
In optical transmission systems, we often use the optical signal-to-noise ratio, OSNR (SNRo) to evaluate the performance of the system. But in the whole transmission system, the receiver bit error rate and other indicators are also related to the electrical signal-to-noise ratio (SNRe).
The concept and influence of electrical signal-to-noise ratio are less discussed in the documents and materials we have encountered. Let’s take a look at the optical signal degraded by the amplified spontaneous emission noise ASE after passing through an optical amplifier, and the electrical signal-to-noise ratio (SNRe) of the current generated when it is incident on the photodetector.
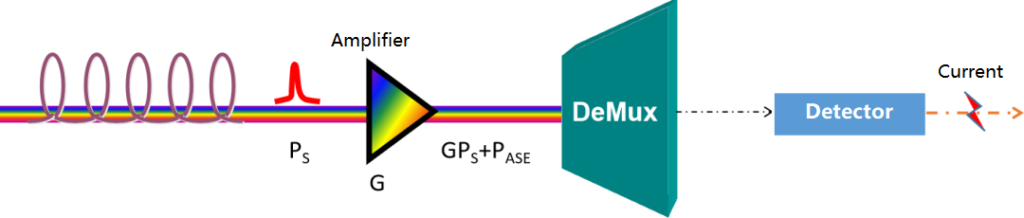
For convenience of discussion, we use the configuration shown in the figure above, and assume that one optical amplifier is used before the receiver to amplify it before detecting a low-power signal. This configuration is sometimes used to improve the sensitivity by increasing the optical power reaching the detector through optical amplification.
ASE-induced Current Fluctuations
In the figure above, the optical amplifier is placed before the detector, which can compensate for the loss caused by the optical fiber line, and improve the optical power at the receiving end to meet the sensitivity of the receiver. However, the optical amplifier also adds ASE spontaneous emission noise to the signal, which generates additional noise in the receiver current.
After the optical wave energy is received by the detector, it converts the optical signal into an electrical signal. The principle is that when light shines on a semiconductor material, photons will collide with electrons in the semiconductor material, causing them to jump to the conduction band, thus forming hole and electron pairs. This effective carrier pair (electron-hole pair) will move in the semiconductor, and form a photocurrent when an external bias is applied.
Since the amplifier has ASE noise generation, we include its contribution to the signal field Es, and the formula for the photocurrent generated by the receiver can be written as:
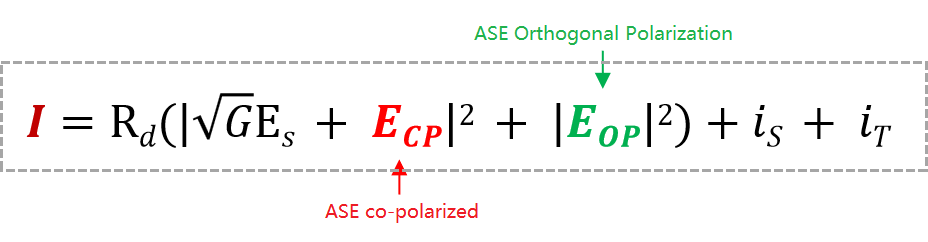
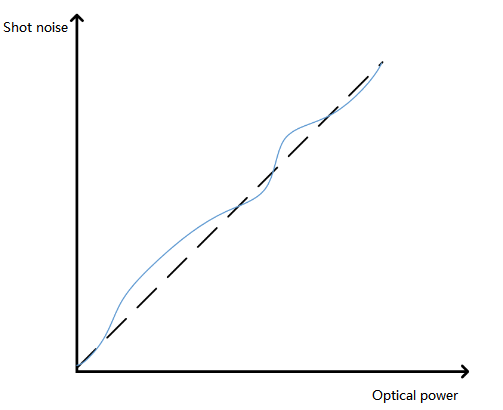
G is the amplifier gain, is and iT are the current fluctuations caused by shot noise and thermal noise, respectively. At the same time, ASE can be divided into two parts, ASE co-polarized part Ecp and orthogonal polarized part Eop. Only the co-polarized ASE part Ecp can beat with the signal. Regarding shot noise, here is a simple explanation, because light is composed of discrete photons (the particle nature of light) and the noise generated during transmission, because it follows a Poisson distribution, it is also called Poisson Noise, as the light intensity increases, the average noise also increases.
Here, please understand that the current noise caused by ASE mainly originates from the beating of Es and Ecp and the beating of ASE with itself.
To better understand this beating phenomenon, please note that ASE occurs on a wider bandwidth than the signal bandwidth Δνs. We can divide the ASE bandwidth Δνo into M segments, each with a bandwidth of Δνs. We can write Ecp as follows:
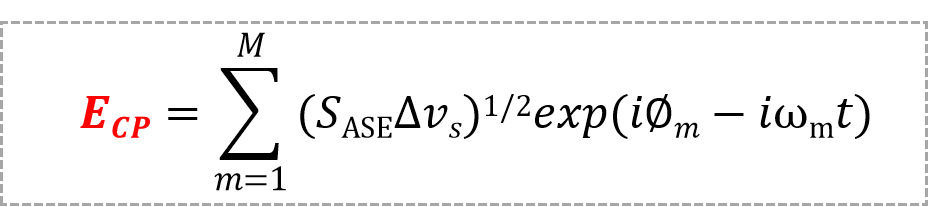
Where Φm is the phase of the noise component at frequency ωm = ωl + m(2πΔνs), ωl is the lower boundary of the filter passband. The ASE spectrum density of the amplifier is:

PS: The form of Eop is the same as Ecp.
Using the following formula and the above expression of Ecp and including all beating terms,

Substituting the above formula for the current I:
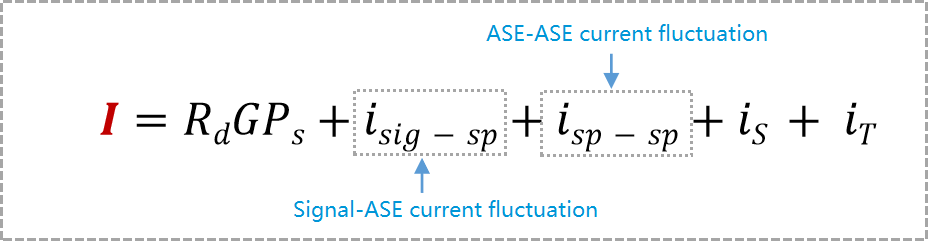
Where, isig – sp and isp – sp are the current fluctuations caused by “signal-ASE” and “ASE-ASE” self-beating, respectively.
Since these two noise currents fluctuate rapidly with time, we need to know their mean and variance. The mean of the current fluctuation of “signal-ASE” ⟨isig – sp⟩ can be derived as 0. However, the current fluctuation of “ASE-ASE” ⟨isp – sp⟩ has a finite value.
In addition, the variances of the two noise currents can also be calculated by the square sum and the time average. We write here directly the total variance of the current fluctuation σ2:
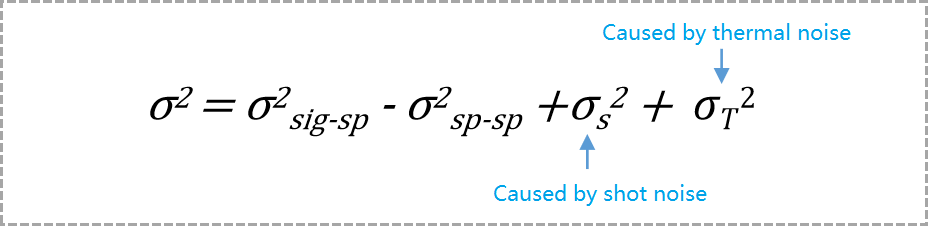
Where the shot noise variance σ2s has an additional contribution from the mean, that is:

Where, Δf is the effective noise bandwidth of the receiver. PASE is the total ASE power entering the receiver.
ASE’s Impact on Signal-To-Noise Ratio
The electrical signal-to-noise ratio SNRe is defined as the ratio of the average signal power to the noise power, which determines the performance of the optical receiver. Considering that the electrical power is proportional to the square of the current, and combining the above discussion, we can calculate the electrical signal-to-noise ratio SNRe of the receiver:

So, since the signal is amplified before detection, is the SNRe signal-to-noise ratio increased or decreased?
To answer this question, we compare the above formula with the signal-to-noise ratio without an optical amplifier.
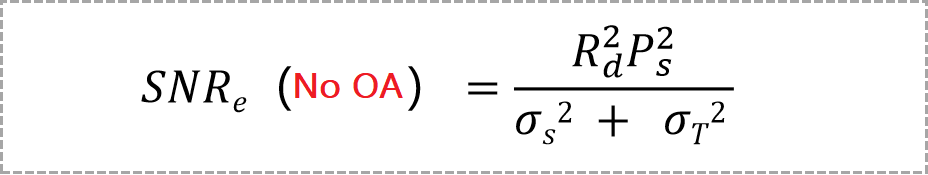
(1) When there is no optical amplifier, that is, assuming G = 1, PASE = 0, then the signal-to-noise ratio is:
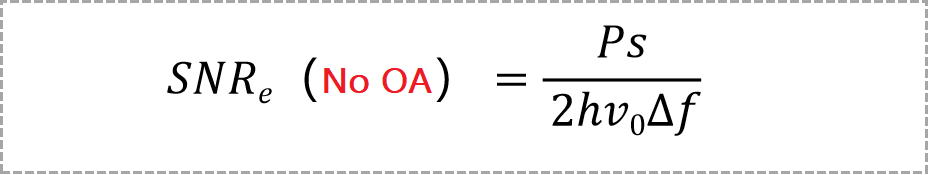
In addition, consider the case of an ideal receiver, which has no thermal noise and a quantum efficiency of 100%, so Rd = q/hν0. In this case, the signal-to-noise ratio without an amplifier is:
(2) When using an optical amplifier, the current variance is dominated by σ2sig – sp. That is, ignore the σ2sp – sp and PASE terms in the above SNRe formula, and it can be found that SNR is:

In fact, thermal noise is much larger than scattered noise, so before concluding that optical amplifiers always reduce SNRe, thermal noise should be taken into account. Ignoring the scattered noise in the above SNRe (no OA) expression and retaining the dominant term σ2sig – sp in the SNRe (OA) expression, we will find that the ratio of electrical signal-to-noise ratio with and without OA is:
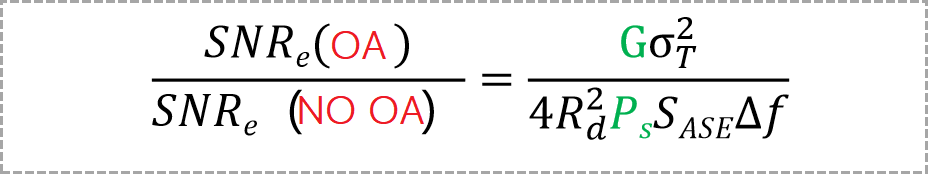
It can be seen from the formula above that reducing Ps and increasing the amplifier gain G can make this ratio quite large.
But we should note that the receiver noise is dominated by σ2sig – sp, which is so large that thermal noise can be ignored, and this apparent contradiction can be understood. In other words, the optically amplified signal helps to mask the thermal noise, thereby improving the signal-to-noise ratio. In fact, if we only keep the dominant noise term, the electrical signal-to-noise ratio SNRe of the amplified signal becomes:

Finally, we compare it with the optical signal-to-noise ratio SNRo=GPs/PASE.

It can be seen from the above equation that under the same conditions, the electrical signal-to-noise ratio SNRe is higher than the optical signal-to-noise ratio SNRo by ∆v0 /2∆f, because ASE noise is only generated on the receiver bandwidth Δf, and the receiver bandwidth is much narrower than the filter bandwidth Δνo.
Noise Accumulation in Optical Amplifier Link
In practice, long-distance WDM systems require cascading multiple optical amplifiers. The accumulation of spontaneous emission noise ASE is the most critical factor for such systems.
First, in the optical amplifier cascaded link, ASE will accumulate on multiple amplifiers, and reduce the signal-to-noise ratio as the number of amplifiers increases.
Second, as the ASE level increases, it starts to saturate the optical amplifier and reduce the gain of the amplifier located downstream of the fiber link. This eventually leads to a decrease in signal level and an increase in ASE level.
In addition, we need to know that the optically amplified system has a self-regulating function, that is, the total power (Ptotal = Ps + PASE) after adding the signal power Ps and PASE power will remain relatively constant. Therefore, we should avoid gain saturation caused by ASE as much as possible.