
OTDR parameter setting
Optical fiber measurement with OTDR can be divided into three steps: parameter setting, data acquisition, and curve analysis. Manually set measurement parameters include:
- Wavelength selection (λ):
Because different wavelengths correspond to different light characteristics (including attenuation, micro-bend, etc.), the test wavelength generally follows the principle of corresponding to the transmission and communication wavelength of the system, that is, if the system is open to 1550 wavelength, the test wavelength is 1550nm.
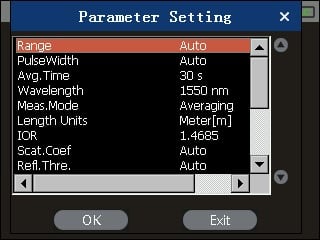
Figure 1. OTDR parameter setting
- Pulse Width:
The longer the pulse width, the larger the dynamic measurement range and the longer the measurement distance. However, the blind area is larger in the OTDR curve waveform, and the pulse width period is usually represented by ns.
- Range:
OTDR measurement range refers to the maximum distance of data sampling obtained by OTDR. The selection of this parameter determines the size of sampling resolution. The best measurement range is 1.5 to 2 times the length of the optical fiber to be measured.
- Average time:
Since the backscattered light signal is extremely weak, the statistical average method is generally adopted to improve the SNR. The longer the average time, the higher the SNR. For example, a gain of 3 minutes will increase the dynamics of 0.8dB over a gain of 1 minute. However, the acquisition time of more than 10min does not improve the SNR significantly. Generally, the average time is not more than 3 minutes.
- Optical fiber parameters:
The setting of optical fiber parameters includes the setting of refractive index, backscattering coefficient and backscattering coefficient η. The refractive index parameter is related to the distance measurement and the backscattering coefficient affects the reflection and return loss measurement results. These two parameters are usually given by the optical fiber manufacturer.
After the parameters are set, OTDR can send optical pulses and receive the light scattered and reflected by the fiber link. The output of the photodetector is sampled to obtain the OTDR curve. The quality of the fiber can be understood by analyzing the curve.
OTDR testing analysis
Normal curve analysis
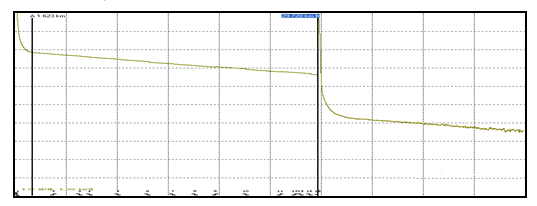
Figure 2. Normal curve analysis
As shown above, to determine whether the curve is normal.
The slope of the main body of the curve is basically the same, and the slope is small, indicating that the line attenuation constant is small and the attenuation inhomogeneity is good.
B1.1 and B4 single-mode fiber attenuation coefficient should be in line with the following table.
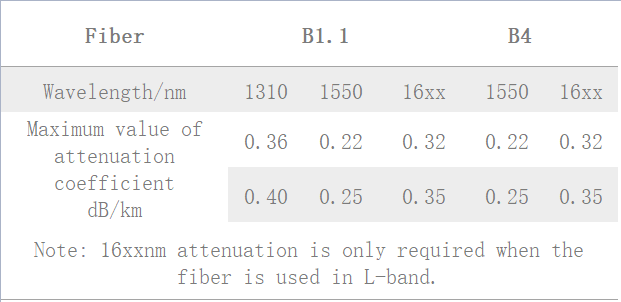
Table 1. B1.1 and B4 single-mode fiber attenuation coefficient
For B1.1 single-mode fiber, at 1310nm wavelength, a continuous fiber length should not exceed 0.1dB discontinuity point, at 1550nm wavelength, a continuous fiber length should not exceed 0.05dB discontinuity point. For B4 single-mode fiber, at 1550nm wavelength, a continuous fiber length should not exceed 0.05dB discontinuity point.
Abnormal curve
- Curve with large steps
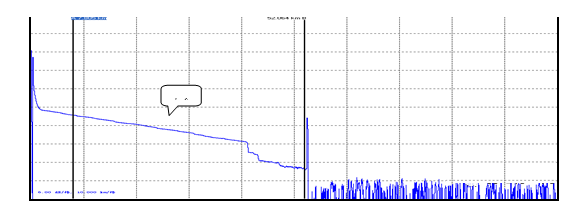
Figure 3. Curve with large steps
As shown above, there are obvious “steps”. If this is a joint, it means that the joint is not qualified or the fiber is too small or extruded in the bending radius of the fusion tray; if this is not a joint, it means that the cable is extruded or sharply bent.
- The curve has a large slope
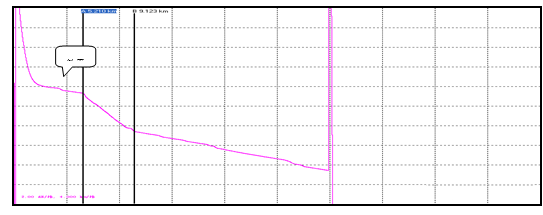
Figure 4. large slope
As shown above, the slope of this section of the curve is significantly larger, indicating that the quality of this section of the fiber is not good, the greater the attenuation.
- Non-reflective break at the far end of the curve
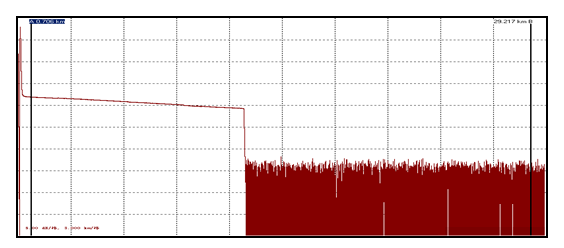
Figure 5. Non-reflective break
As shown above, there is no reflection break at the end of this curve, which means that the distal end of this fiber is not good quality or the distal fiber is broken here.
- Identification and processing of phantom peaks (ghosts)
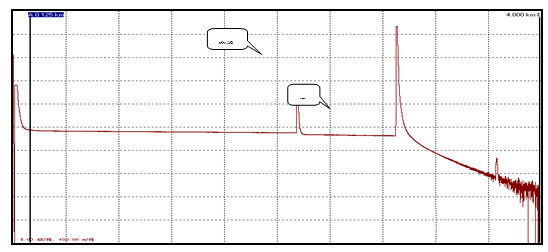
Figure 6. Identification of phantom peak (ghosts)
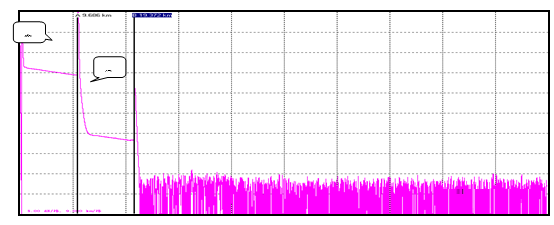
Figure 7. Eliminate phantom peaks (ghosts)
Identification of phantom peak (ghosts): the ghosts on the curve do not cause obvious loss (Figure 6); the distance between the ghost and the beginning of the curve is a multiple of the distance between the strong reflection event and the beginning and becomes symmetrical (Figure 7).
Eliminate phantom peaks (ghosts): select short pulse widths, and add attenuation in the strongly reflective front end (e.g., OTDR output). If the event causing the ghosting is located at the end of the fiber, you can “make a small bend” to attenuate the light reflected back to the beginning.
- Gainer processing
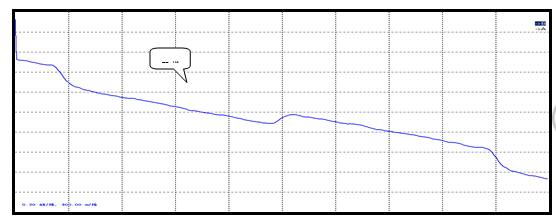
Figure 8. Gainer
Gainer may be generated on the OTDR curve, as shown in Figure 8. Positive gain is formed because the fiber after the fusion point produces more backward scattered light than the fiber before the fusion point.
In fact, the fiber is fusion-lossy at this fusion point. It often occurs during the fusion of fibers with different mode field diameters or different backscatter coefficients, so it is necessary to measure in both directions and average the results as this fusion loss. In practical fiber optic cable maintenance, the average splice loss is ≤ 0.08 dB.
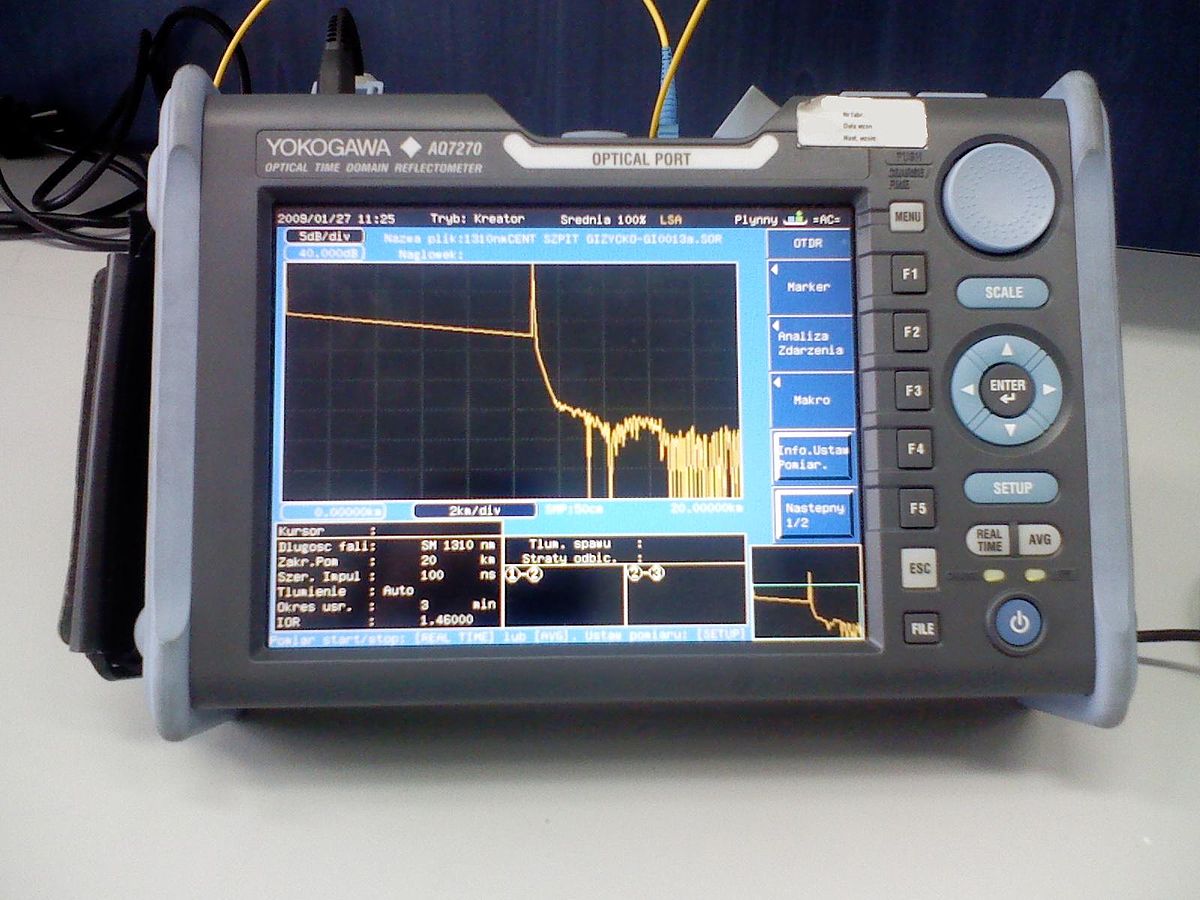
Figure 9. Optical Time Domain Reflectometer
Cautions
- Simple discrimination of optical fiber quality:
Normally, the slope of the main body of the optical curve (single or several optical cables) tested by OTDR is basically the same. If the slope of a certain section is large, it indicates that the attenuation of this section is large. If the main body of the curve has an irregular shape, large slope fluctuation, bending, or arc shape, it indicates that the quality of the fiber is seriously deteriorated and does not meet the requirements of communication.
- Selection of wavelength and single and dual direction test:
The 1550 wavelength measurement distance is longer, 1550nm than 1310nm fiber is more sensitive to bending, 1550nm than 1310nm unit length attenuation, 1310nm than 1550nm measurement of welding or connector loss is higher. In the actual maintenance of optical cables, the two wavelengths are generally tested and compared. Both the positive gain phenomenon and the over-distance line must be analyzed and calculated in two directions to obtain a good test conclusion.
- Joint cleaning:
Before connecting the optical fiber live connector to the OTDR, it must be carefully cleaned, including the output connector of the OTDR and the measured live connector.
Otherwise, the insertion loss is too great, the measurement is unreliable, the curve is noisy, and even makes the measurement impossible, and it may damage the OTDR. Avoid cleaning agents or refractive index matching solutions other than alcohol because they can dissolve the adhesive inside the fiber connector.