
Dmitri ordered six amplifiers for a metro build. All were C-band, specified for a 40-channel configuration, and listed as boosters.
Two had 17 dB of gain and a listed “saturated optical power” value of +3 dBm. The other four had 25 dB of gain and a listed value of −5 dBm. The listings stated maximum output power separately, so these saturation figures should not be described as saturated output power unless the manufacturer explicitly defines them that way.
They did not behave as Dmitri expected. Under the actual input conditions, the high-gain units reached their saturation limit, while the lower-gain units could not provide the required gain at positions with weaker input signals.
The name on the box told him the intended role, but not the full operating envelope. The real risk in DWDM amplifier selection is assuming that a role label makes products interchangeable without checking gain, input range, output power, and saturation specifications.
Here is what the three roles actually mean, which four specs help determine the choice, and the selection order that avoids Dmitri’s mistake. If you know your span loss and channel count, send both to FiberMall’s optical engineers, and we’ll help size the DWDM amplifier against your link budget.
What Is a DWDM Amplifier?
A DWDM amplifier boosts optical signals at multiple wavelengths simultaneously without converting them to electrical signals. It compensates for fiber-span and component losses so that the signal reaches the next node at the required power level.
The key advantage is that one optical amplifier can amplify multiple wavelength channels at once. An optical-electrical-optical (OEO) regenerator, by contrast, converts the signal to electrical form, processes or regenerates it, and converts it back to optical form. An optical amplifier does not perform the same job as a regenerator: it boosts optical power but does not retime, reshape, or regenerate the data. Its usable channel count and aggregate power are limited by the supported optical band and system design, even though its operation is generally transparent to the channels’ bit rates.
The trade-off is noise. An amplifier does not clean the signal; it adds amplified spontaneous emission (ASE) noise along with the gain. That accumulated noise can limit the reach of a link before regeneration or another system-level change is required. In short, an amplifier can extend reach, but it does not restore signal quality.
How an EDFA Is Built
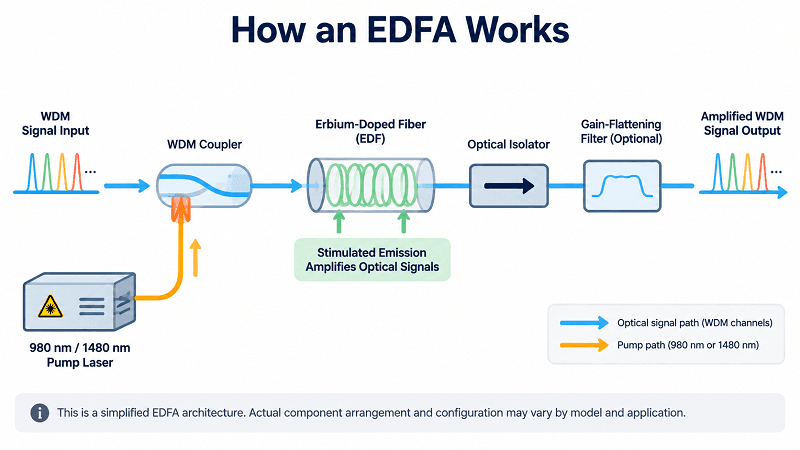
Most DWDM optical amplifiers are erbium-doped fiber amplifiers (EDFAs), which are widely used in metro and long-haul systems. A length of silica fiber doped with erbium is pumped by a laser, commonly at 980 nm or 1480 nm. The pump excites erbium ions; stimulated emission then adds optical energy to signals within the amplifier’s gain band.
Other components may include couplers, isolators, a gain-flattening filter, a variable optical attenuator (VOA), and monitoring taps. Performance depends on the erbium-doped fiber, pump arrangement, filtering, and control loop. If you’re new to the multiplexing layer, the DWDM complete guide covers channels and components first.
The Three EDFA Roles: Booster, Line, and Pre-Amplifier
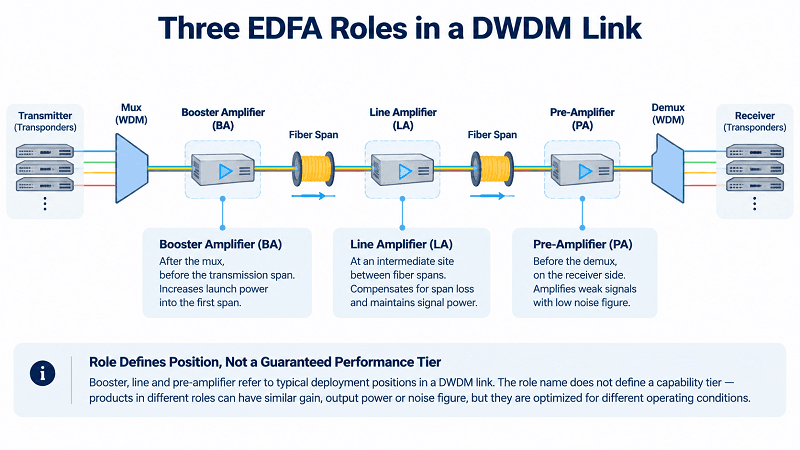
Here is the distinction that decides most purchases, and the one spec sheets never state plainly. The role constrains which specs matter. It does not define a capability tier. A booster and a pre-amplifier can share the same gain figure and still be completely different products.
| Role | Position | Spec that matters most | Typical gain | Typical output | Typical input |
| Booster (BA) | After the mux, before the span | Output power | 15–25 dB | +17 to +20 dBm | −22 to +8 dBm |
| Line (LA) | Mid-span at an intermediate site | Gain and noise figure together | 20–30 dB | +17 to +20 dBm | −32 to 0 dBm |
| Pre-amplifier (PA) | Before the demux, at the receiver | Noise figure | 25–30 dB | +13 to +16 dBm | −32 to 0 dBm |
These are illustrative, model-dependent ranges, not universal standards. Exact gain, input range, output power, noise figure, and saturation specifications vary by model, and rated gain may not be available across the entire input range. If the actual input falls outside the specified operating range, the amplifier may not deliver the required gain or output. Check the full datasheet rather than relying on the role label.
Boosters raise the composite WDM signal to the target launch power and usually sit immediately after the multiplexer. They are often selected for output-power capability rather than maximum gain alone. Fiber nonlinearity limits how much launch power is useful. In some conventional G.652.D systems, aggregate launch powers around +17 to +21 dBm may approach a practical design limit, but this is not a universal threshold: nonlinear penalties depend on per-channel power, channel loading, span length, modulation format, dispersion, and fiber characteristics.
Line amplifiers compensate for span and node losses between transmission sections. As a first-order starting point, a span with 22 dB of loss may call for roughly 22 dB of gain, but the final setting also depends on node insertion loss, target per-channel power, and the amplifier’s operating limits. Excessive gain can overdrive the next span; insufficient gain can cause power levels to fall through the cascade. Overall gain error and wavelength-dependent gain tilt are different issues: a uniform 0.5 dB gain offset does not, by itself, create 0.5 dB of spectral tilt.
Pre-amplifiers sit at the receive end, typically before the demultiplexer or receiver-side optical stage. They handle weak incoming signals, so noise figure is especially important. Output-power capability still matters: the pre-amplifier must deliver a suitable level to downstream components without exceeding their input limits. A low-noise pre-amplifier can be a cost-effective way to improve the margin of a marginal link, but its benefit must be confirmed in the end-to-end OSNR budget.
Why the Names Mislead
Dmitri’s 17 dB and 25 dB units differed in gain and in their listed saturation figures. Those numbers alone did not establish how each unit would behave under the actual composite input power; he needed to verify the definition of the saturation parameter, the input operating range, and the maximum output power. Although all were listed as C-band, 40-channel boosters, they were not interchangeable for every position in the design. Half the order was wrong for its assigned slot because he selected by label rather than by the complete specifications.
Specify gain, output power, noise figure, and input range. Never specify a DWDM amplifier by role name alone.
Gain Band: C, L, and Extended C
Erbium amplifies over a limited range, and that range decides how many channels you can carry.
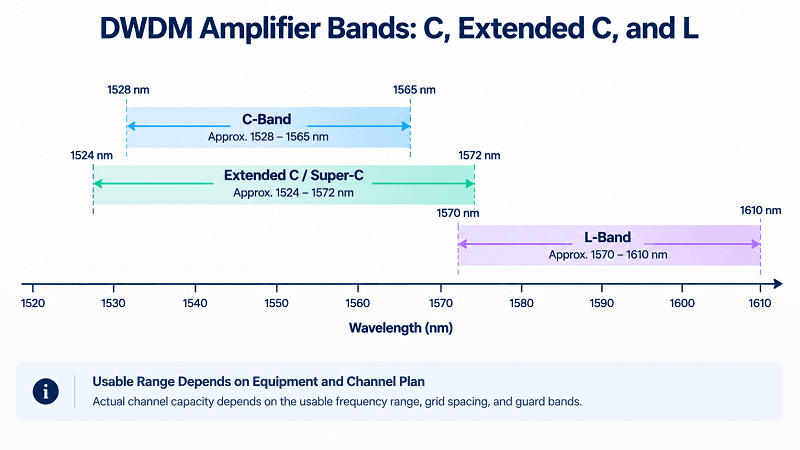
| Band | Approximate wavelength range | Estimated channels at 50 GHz | Use when |
| C-band | 1528–1565 nm | ~90–94 | The standard choice for many DWDM systems, with a mature component ecosystem |
| Extended C / Super-C | ~1524–1572 nm | ~120 | Additional capacity is needed before adding a separate L-band system |
| L-band | 1570–1610 nm | ~90–96 | The supported C-band spectrum is fully utilized and compatible L-band equipment is available |
The channel counts above are planning estimates, not fixed standards. Exact counts depend on the usable frequency range, the specified grid, edge guard bands, and the capabilities of the amplifiers and wavelength-selective components. ITU-T G.694.1 defines the DWDM frequency grid, including fixed and flexible grid options.
C-band lies within a low-attenuation region of standard single-mode fiber near 1550 nm and overlaps the erbium gain region. Many C-band EDFAs offer favorable noise performance and a mature component ecosystem, which is why C-band is common in DWDM deployments.
The DWDM channel plan determines which frequencies must be supported. The selected amplifier band needs to cover the planned channels with suitable margin at both edges, where gain flatness and noise performance may differ from mid-band values.
L-band can approximately double the available channel capacity on the same fiber pair if a comparable usable spectrum and compatible equipment are available. It is not free: L-band deployment generally requires L-band amplifiers and compatible mux/demux, ROADM, and transceiver equipment, and its noise performance depends on the specific system. Before adding a new band, evaluate whether tighter channel spacing or a supported higher-order modulation format could increase capacity. These options are not necessarily configuration-only changes; the transponders, filters, ROADMs, and OSNR budget must support them.
Noise Figure: The Spec That Decides Reach
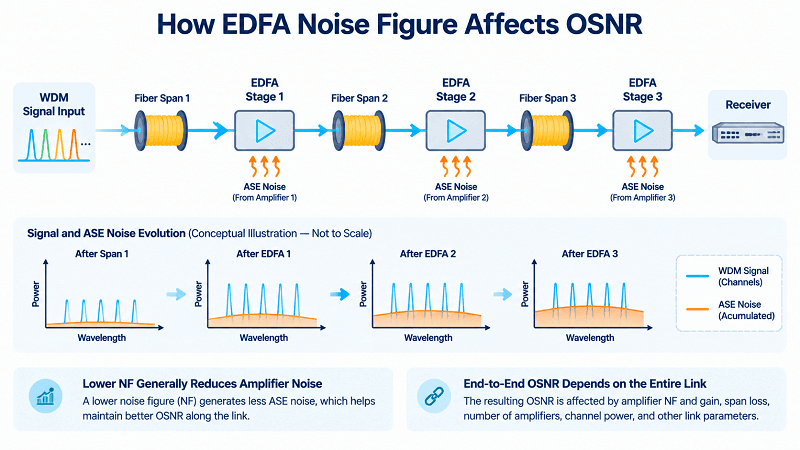
Noise figure is the amount of signal quality a DWDM amplifier costs you, in dB. Lower is better, and in a cascade it compounds. Typical C-band units run 4.5 to 6 dB. Below 5 dB is good; below 4.5 dB is premium and you pay for it.
What Noise Figure Actually Costs
NF is not a universal one-to-one conversion into end-to-end OSNR or reach. Under otherwise comparable operating conditions, a 1 dB improvement in NF can contribute roughly a 1 dB improvement in OSNR, but the actual result depends on amplifier gain, signal power, span loss, ASE accumulation, and the rest of the link.
The DWDM network design guide explains the full OSNR budget. As a simplified example, if a route has 3 dB of OSNR margin, choosing a 5.5 dB NF amplifier instead of a 4.5 dB model could consume about 1 dB of that margin under comparable conditions. Confirm the impact with an end-to-end link calculation.
In a cascade, the noise contribution of each amplifier depends on its noise figure, gain, and input signal level. The Friis relationship explains why early stages can have a disproportionate influence in a cascade, but it does not mean the first amplifier always dominates every optical link. Evaluate the complete chain, paying particular attention to the first amplification stage and the receiver-side pre-amplifier.
980 nm vs 1480 nm Pumping
Pump wavelength affects an EDFA’s noise performance and efficiency. A 980 nm pump can support a high erbium-inversion level and low noise figure. A 1480 nm pump can be more power-efficient and can support high output power, depending on the amplifier design and operating point. The relative noise figure and output capability vary by architecture, so neither wavelength is universally best.
In broad terms, 980 nm pumping is often favored when low noise figure is a priority, while 1480 nm pumping or a hybrid pump arrangement may be selected when output power and efficiency are important. The best choice depends on the amplifier’s design and the link budget, not simply on whether it is a pre-amplifier or booster.
Two datasheets quoting 5.0 dB are not necessarily equivalent. Compare noise figure at the same gain, input power, wavelength, channel loading, and measurement conditions. NF and gain flatness can vary across the operating band, so a single mid-band value may not represent edge-channel performance.
Gain Flatness and Tilt
An EDFA’s gain varies with wavelength. The uncorrected gain profile can peak near 1530 nm and fall toward parts of the band, so many DWDM amplifiers use a gain-flattening filter or another equalization mechanism. The specified flatness depends on the model and operating conditions; check the datasheet’s definition and measurement range.
Flatness matters because wavelength-dependent errors can accumulate through a cascade. Ana encountered this on a nine-amplifier route where each unit met its stated 0.5 dB flatness specification.
If each stage contributes up to 0.5 dB of wavelength-dependent deviation in the same direction, a simple worst-case estimate across nine stages can approach 4.5 dB. That is not an inevitable result: actual cumulative tilt depends on the spectral response, gain setting, and equalization of each amplifier. In Ana’s case, mid-band channels looked healthy while two edge channels approached the FEC limit. A spectrum sweep revealed the channel-to-channel power imbalance after span-loss checks had failed to explain it.
Check cumulative spectral flatness, not just the per-unit specification. An optical spectrum analyzer (OSA) sweep can quickly reveal wavelength-dependent power imbalance that a BER test alone may not localize.
Output Power, Saturation, and Per-Channel Power
An amplifier’s rated output power usually refers to the combined optical power across all active channels under specified conditions. If the channels have equal power, the total is shared among them; in practice, channel power can differ because of gain tilt, loading, and control settings.
The Per-Channel Arithmetic
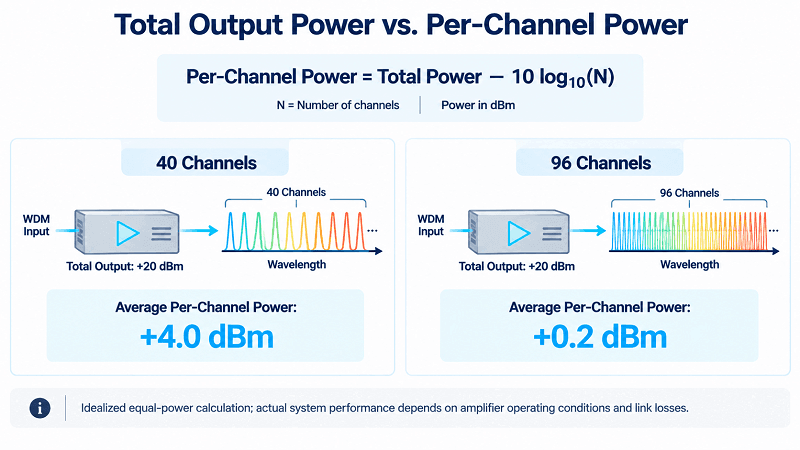
For equal-power channels, estimate per-channel output by subtracting 10·log10 of the channel count from the total output power, with both powers expressed in dBm:
Per-channel power = total output − 10·log10(channel count)
A +20 dBm DWDM amplifier carrying 40 equal-power channels delivers approximately 20 − 16.0 = +4.0 dBm per channel. The same total output shared across 96 equal-power channels gives 20 − 19.8 = +0.2 dBm per channel.
At the same aggregate output power, 96 channels therefore receive about 3.8 dB less optical power per channel than 40 channels. That is a per-channel power difference, not automatically a 3.8 dB reduction in every form of system margin.
Wei’s team encountered this on a regional route. Their amplifier had been sized for 40 channels at +20 dBm total output and operated with comfortable margin for two years. When the system expanded to 96 channels without a corresponding power-budget review, the per-channel launch power fell by 3.8 dB. In an otherwise comparable ASE-limited system, that can cause a similar OSNR penalty, but the actual OSNR change depends on amplifier behavior and operating settings.
Nothing had failed; the amplifier was behaving according to the power-sharing arithmetic.
That is why a system designed for 40 channels is not automatically ready for 96. Capacity planning must include the amplifier, not just the mux and transceivers.
Saturation and Control Modes
Saturated output power is the upper limit of an amplifier’s output under specified conditions. As the amplifier approaches saturation, gain compresses and channel powers may no longer scale linearly with input. Changes in channel loading can also produce transient power shifts or cross-gain effects. Do not apply a universal “80–90% of rated output” rule; leave operating margin according to the manufacturer’s specifications, channel loading, and the link’s nonlinear-power budget.
Three control modes appear on many datasheets, but their exact implementation can vary by vendor. AGC typically maintains a target gain and is commonly used for line amplification when span loss is known. APC typically regulates output power and is often suitable for booster applications that require a defined launch level. ACC maintains pump current, so gain and output can vary as input power changes. Confirm what each mode controls on the specific product rather than assuming the labels are identical across vendors.
Transient suppression addresses changes over time. When channels are dropped, the remaining channels can experience a power surge unless the amplifier’s control loop responds appropriately. The control mode and transient behavior must suit the network’s add/drop pattern; otherwise, channel changes can create power variations that resemble a fiber fault.
Amplifier Spacing, Raman, and SOA
Span Loss, Not Distance
In conventional terrestrial DWDM systems, 60–80 km is a common initial planning range for amplifier spacing, but 80 km is not a universal design rule. Span loss is the more useful constraint. Some systems are designed around roughly 20–24 dB of span loss, but the target must match the amplifier’s gain and input range, the OSNR budget, and the platform design.
Add/drop sites introduce insertion loss that must be included in the optical path budget. The effect depends on the node architecture and where the components sit relative to the amplifiers. Lower-loss fiber and careful splice/connector design can support longer spans; higher-loss legacy plant or additional node losses may require shorter spans. For background, see FiberMall’s DWDM OADM guide.
What a Cascade Costs
Each optical amplifier adds ASE noise, and OSNR generally degrades as noise accumulates through a cascade. Under simplified assumptions—comparable amplifier noise figures, similar per-channel output powers, and similar span losses—the accumulated noise may follow an approximate 10·log10(N) relationship for N stages. Doubling the amplifier count can therefore imply roughly a 3 dB penalty under those assumptions, but it is not a universal rule regardless of span length or operating conditions. Eight 40 km spans cannot automatically be declared worse than four 80 km spans: shorter spans require less gain per stage, and the result depends on span loss, amplifier gain and NF, node losses, launch power, and nonlinear effects. Compare the complete link budgets.
If the end-to-end OSNR falls below the requirement of the chosen transmission format, options may include OEO regeneration, a more robust modulation format, a lower-capacity wavelength, or a different amplifier/span design. A 400G service that cannot close within the available margin might be supported at 200G if the transponder and service requirements allow it. Cisco’s DWDM planning guide discusses optical amplifier cascades and system-level planning in more depth.
EDFA vs Raman vs SOA
Three gain media, three different trades.
| Amplifier | Gain medium | Noise figure | Best use | Main drawback |
| EDFA | Erbium-doped fiber | Often around 4.5–6 dB; model-dependent | General-purpose metro and long-haul amplification | ASE accumulation and wavelength-dependent gain |
| Raman | The transmission fiber, through stimulated Raman scattering | Can improve effective NF; system-dependent | OSNR-limited or longer spans where distributed gain helps | Pump power, laser safety, cost, and commissioning complexity |
| SOA | Semiconductor | Often higher than a comparable EDFA | Selected access, short-reach, or compact designs | Cross-gain modulation and other multi-channel penalties |
Raman amplification uses stimulated Raman scattering in the transmission fiber to provide distributed gain rather than concentrating all gain in a discrete amplifier. It can improve effective OSNR performance and extend reach in suitable designs, but it adds pump-power requirements, laser-safety considerations, and commissioning complexity. It is a targeted option rather than a default upgrade.
SOAs can be compact and cost-effective, but they often have a higher noise figure than comparable EDFAs in relevant DWDM applications. In multi-wavelength operation, variations in total optical power can change the semiconductor gain and introduce cross-gain modulation or related channel penalties. SOAs can be suitable for specific access and short-reach designs, but they are not general drop-in replacements for EDFAs in long-haul DWDM systems. FiberMall stocks semiconductor optical amplifiers alongside its EDFA range.
For long unrepeatered links, a hybrid Raman/EDFA architecture may improve transmission performance by combining distributed Raman gain with lumped amplification. The placement, pump direction, and gain allocation should be determined by the link budget and system design rather than a fixed “Raman first, EDFA second” rule.
Choosing a DWDM Amplifier
Work in this order; each step narrows the next.
1. Fix the band from the channel plan, including margin at both edges
2. Fix the role from the amplifier’s position in the link
3. Size output power from channel count and the nonlinear ceiling
4. Set the noise figure target from whatever OSNR margin remains
5. Confirm the input range covers your worst-case receive level
6. Choose the control mode for the role: AGC for line, APC for booster
7. Confirm management (SNMP, RS-232, or web), form factor, power, and rack space
Steps 3 and 4 involve the main trade-off. Higher per-channel launch power can improve OSNR in some operating regimes, but only until amplifier saturation, fiber nonlinearities, and receiver limits become significant. A lower NF generally improves OSNR under otherwise comparable conditions, but the system benefit must be weighed against cost. On many routes, a well-matched mid-range DWDM amplifier with suitable noise performance is more cost-effective than simply choosing the highest-output model.
What FiberMall Stocks
FiberMall’s EDFA amplifier catalog includes booster, line-amplifier, and pre-amplifier configurations, with supported control modes and management options varying by model. The broader catalog lists gain values from about 12 to 40 dB and output power from roughly +13 dBm to +37 dBm or higher across different optical-amplifier families. The highest-output models are specialized high-power EYDFA products for applications such as CATV/FTTH and should not be treated as typical DWDM EDFA specifications. Typical DWDM EDFA noise figures are often around 4.5–6 dB. C-band (1528–1565 nm) and L-band (1570–1610 nm) options, channel counts, and 100/50 GHz plans depend on the individual model and supported grid. Always confirm the exact product datasheet.
Representative configurations include a 25 dB-gain model with +16 dBm maximum output that may suit a receive-side pre-amplifier role if its NF and input range meet the budget; a 17 dB-gain model with +20 dBm maximum output for a booster application; and a 25 dB-gain, +20 dBm maximum-output model with a built-in VOA for selected in-line applications. These are examples, not role definitions: final selection must account for gain, input range, output power, noise figure, control mode, and channel loading.
Sizing an order? Send the span loss, channel count, band, and target reach to FiberMall’s optical engineering team. Our engineers can help confirm the required gain, output power, noise figure, and control mode before you commit.
FAQ
What is a DWDM amplifier?
A device that amplifies optical signals at multiple wavelengths simultaneously without optical-electrical conversion. It compensates for span and component losses, but it does not regenerate data. The supported band, channel loading, and power range depend on the model and system design.
What are the three types of EDFA in a DWDM system?
Booster amplifiers sit after the transmitter or mux and set launch power. Line amplifiers compensate for span and node losses between spans. Pre-amplifiers raise weak receive-side signals before downstream components. These names describe typical positions and roles, not a guaranteed performance tier.
What noise figure should an EDFA have?
Many C-band EDFAs specify a noise figure around 4.5–6 dB, but the appropriate target depends on the link budget. Compare products at the same gain, input power, wavelength, channel loading, and measurement conditions.
Why can 980 nm pumping provide a lower noise figure than 1480 nm?
A 980 nm pump can support a high erbium-inversion level and low noise figure. A 1480 nm pump can offer efficiency or output-power advantages in some designs, but the actual trade-off depends on the amplifier architecture and operating point.
When should you consider Raman amplification alongside an EDFA?
Consider it when the link is OSNR-limited and the link analysis shows that distributed Raman gain can provide useful margin. Raman is often combined with EDFA rather than used as a direct replacement, and it adds pump-power, laser-safety, and commissioning requirements.
Conclusion
DWDM amplifier selection comes down to a few rules that are easy to get wrong.
Role names describe position, not capability, so specify gain, output power, noise figure, input range, and saturation behavior instead of ordering by the word “booster” alone. Lower noise figure generally helps OSNR, but end-to-end reach depends on the complete amplifier chain and link budget; no single stage always dominates. At fixed total output power, per-channel power falls as channel count rises. Check spectral flatness across the cascade, because wavelength-dependent deviations can accumulate even when mid-band channels look healthy.
Dmitri replaced two of the six units, and the route came up. The replacement order specified gain, output power, input range, and saturation behavior rather than relying on a category name.
Send FiberMall your span loss, channel count, band, and target reach, and our engineers will help confirm the configuration before you buy. Request an amplifier sizing check.
Related Products:
-
 DWDM MUX DEMUX 50GHZ 96CH (C15-C62) LC/UPC Dual Fiber 2U Rack
$6000.00
-
DWDM MUX DEMUX 40CH (C21-C60) LC/UPC Dual Fiber 1U Rack
$1100.00
-
DWDM MUX DEMUX 16CH (C21-C36) with Monitor Port LC/UPC Dual Fiber 1U Rack
$800.00
-
DWDM MUX DEMUX 8CH (C21-C28) with Express Port LC/UPC Dual Fiber LGX BOX
$500.00
-
DWDM MUX 8CH 16 Wavlengths (TX: C43/C45/C47/C49/C51/C53/C55/C57 RX: C44/C46/C48/C50/C52/C54/C56/C58) with MON Port LC/UPC Single Fiber LGX BOX
$450.00
-
SFP-DW10G17-40C 10G DWDM SFP+ C17 100GHz 1563.86nm 40km LC SMF DDM Transceiver Module
$155.00
-
SFP-DW10G17-80C 10G DWDM SFP+ C17 100GHz 1563.86nm 80km LC SMF DDM Transceiver Module
$175.00
-
SFP-DW10G17-100C 10G DWDM SFP+ C17 100GHz 1563.86nm 100km LC SMF DDM Transceiver Module
$235.00
-
SFP-DW10GTU-40C 10G DWDM Tunable SFP+ 50GHz 1529.55nm~1561.83nm 40km LC SMF DDM Transceiver Module
$550.00
-
SFP-DW10GTU-80C 10G DWDM Tunable SFP+ 50GHz 1529.55nm~1561.83nm 80km LC SMF DDM Transceiver Module
$750.00
-
OSFP-400G-DCO-ZR 400G Coherent OSFP-DCO ZR C-band Tunable Optical Transceiver Module
$7000.00
-
OSFP-400G-DCO-ZR+ 400G Coherent OSFP-DCO ZR+ C-band Tunable Optical Transceiver Module
$7000.00
-
OSFP-800G-DCO-ZR+-HTx 800G Coherent High TX Power OSFP DCO ZR+ C-band Tunable Optical Transceiver Module
$12000.00
-
OSFP-800G-DCO-ZR-HTx 800G Coherent High TX Power OSFP DCO ZR C-band Tunable Optical Transceiver Module
$11000.00
-
QSFP-DD-400G-DCO-ZR 400G Coherent QSFP-DD DCO C-band Tunable Optical Transceiver Module
$4550.00
-
QSFP-DD-400G-DCO-ZR+ 400G Coherent QSFP-DD DCO C-band Tunable Optical Transceiver Module
$4680.00
-
QSFP-DD-400G-DCO-ZR+-HTx 400G Coherent High TX Power QSFP-DD DCO OpenZR+ C-band Tunable Optical Transceiver Module
$5500.00
-
QSFP-DD-400G-DCO-ZR-HTx 400G Coherent High TX Power QSFP-DD DCO ZR C-band Tunable Optical Transceiver Module
$5200.00