
In the manuals of high-speed optical modules, we usually focus on ER and OMA related to DML or EML. So, what do they mean? What is the relationship between the two indicators? What are their appropriate values? How to test them? Let’s talk about ER and OMA with these questions.
- Definition and calculation
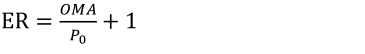
ER, extinction ratio, refers to the ratio of light powers when the signal is sent at high level and low level, namely:
Formula (1)
However, what is usually seen in the manual is its logarithmic form, that is, ERdB = 10*log10(ER). If the optical power P1 and P0 of sending “1” and “0” are both in dBm units, the logarithmic extinction ratio is equal to the difference between the two powers, ie ERdB) = P1(dBm) -P0(dBm).
OMA, optical modulation amplitude, refers to the difference in optical power between high level and low level after the optical signal is modulated, namely:
Formula (2)
Obviously, both ER and OMA represent the difference in optical power between high-level and low-level signals, but ER represents a relative difference, while OMA represents an absolute difference.
- Meanings and conversion
So why are ER and OMA important?
The greater the optical power discrimination between “1” and “0”, the easier it is to distinguish “1” and “0” at the receiving end, and the bit error rate (BER) will be smaller. In fact, it is easy to prove this in theory.
The definition of the quality factor Q is shown as the following formula:
Formula (3)
The numerator is the difference between the optical powers of the high and low levels, that is, OMA, and the denominator is the sum of the standard deviations of the high and low levels, which actually represents the size of the noise. For thermal noise-limited PIN receivers, high and low levels correspond to the same noise. Thus, for a given receiver, the Q factor is determined only by the OMA. There’s a functional relationship between Q and BER, namely:
Formula (4)
Therefore, the difference of optical powers between the high and low levels directly reflects the performance of the optical module. So, is there any relationship between these two indicators for measuring the difference in optical power?
In order to determine the relationship between relative difference and absolute difference, it is necessary to introduce an intermediate quantity as a reference. This amount is the commonly used average optical power Pave. It is defined as:
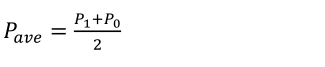
Formula (5)
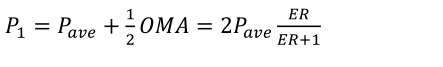
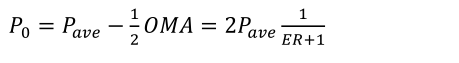
Combining formulas (1), (2), and (3), after variable substitution, we can easily obtain the relationship between OMA and ER by using the intermediate quantity Pave.
![]()
Formula (6)
Formula (7)
And the relationship between P1, P0 and ER and Pave.
 Formula (8)
Formula (9)
From (3) ~ (7), we can know that only two of the five quantities P1, P0, Pave, ER, and OMA are independent, and we can obtain the other values if any two of the above values are given. Based on this, in the following analysis, we will choose Pave and ER for further analysis. Of course, there is still a difference between ER and OMA. After the optical signal is attenuated, the ER remains unchanged, but the OMA decreases according to the signal attenuation coefficient, and vice versa after optical amplification.
ER and OMA can be clearly shown in the eye diagram. The larger the ER and OMA, the better the opening in the diagram.
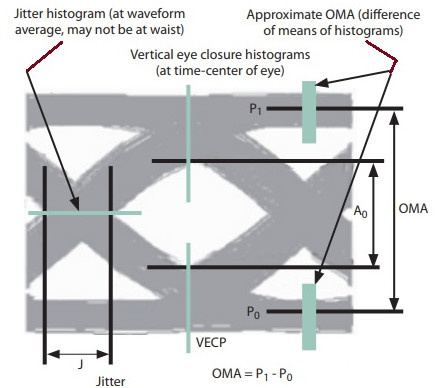
Figure 1 Example of an OMA in an eye diagram
- The price and actual value of ER
The above analysis is only from the perspective of receiver sensitivity (or BER). Larger ER or OMA is good for improving BER. It can be further calculated that when ER is infinite, the power cost introduced by limited ER is:
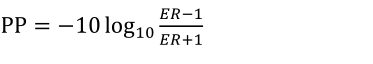
Formula (10)
From the above formula, it can be seen that for an ER of about 6 dB (such as DML), the introduced power penalty is about 2 dB, and for an ER of about 9 dB (such as EML), the introduced power penalty is about 1 dB. This also explains why EML usually performs better than DML, partly because EML has a higher extinction ratio. For direct modulated modules, is the higher the extinction ratio the better?
Let’s see how to improve the extinction ratio of DML first. By definition, it is to increase the relative difference between the optical powers of the laser on and off. The most direct way is to increase the amplitude of the driving voltage and increase the difference between the high level and the low level. But this brings two problems.
On one hand, the increase of the driving voltage amplitude will easily lead to the alternating change of the carrier density in the DML, which will cause the change of the refractive index of the active area, the wavelength of the laser will drift, and the current will drift due to the wavelength of the laser, commonly known as chirp. The final result is that the wavelength of low-level optical signal is long, and the wavelength of high-level optical signal is short. The transmission speed of the two in the fiber is different, thus causing the bandwidth expansion of the time domain of the signal, leading to inter-symbol interference (ISI). Therefore, a high ER may also increase the chirp penalty for DML.
On the other hand, the conversion of the laser from low power (P0) to high power output (P1) takes time, which is related to the transit time of the carrier. When the power difference becomes larger, the transit time will increase, thereby reducing the modulation bandwidth. Therefore, the ER of high-speed DML is usually smaller.
How big is the ER in reality? It depends on the DC bias of the DML. As shown in Figure 2, in order to reduce the electro-optical delay, relaxation oscillation and pattern effect in high-speed DML, the bias point of DML is usually near the threshold value, which means that when sending “0”, the laser is also emitting light, that is, P0 is not 0, which obviously reduces ER.
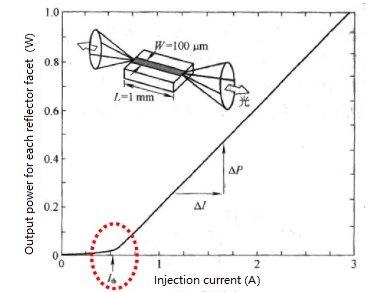
Figure 2 Typical PI characteristic curve of a semiconductor laser
For the receiver, there is an overload optical power PRth, that is, when the received average optical power exceeds this value, the receiver is saturated and cannot work normally. Therefore, P1 is required not to exceed 2PRth-P0 during normal operation, so the maximum extinction ratio is ER max = 2PRth/P0-1.
Figure 3 shows the relationship between the power penalty and ER calculated by formula (8). It is found that when the ER exceeds 20 dB, there is basically no impact on performance. After exceeding 15 dB, ER improvement has little effect on performance improvement. Therefore, too high ER may increase power consumption.
For 25G NZR signals, the ER of commercial DML is usually 4~6 dB, while the ER of EML is 8~10 dB.
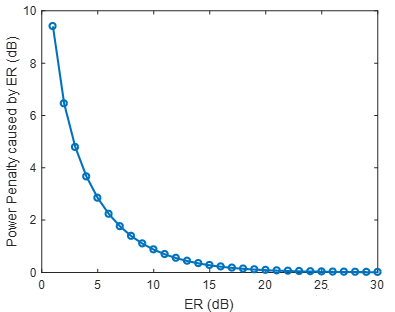
Figure 3 Power penalty due to finite extinction ratio
4. Optical module and ER test
Let’s talk about how to test ER. In fact, it’s easy to teat ER, but the entire optical module needs to be tested a lot, as shown in Figure 4.
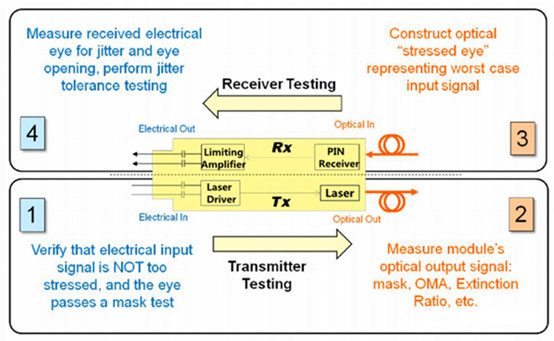
Figure 4 Schematic diagram of the main test items of the short-range optical module
At the sending end, there are two main tests, 1 is the electric eye diagram of the input signal to ensure that the quality of the input signal is good enough. 2 is to test the quality of the modulated optical signal, such as optical eye diagram, ER, and OMA. An eye diagram instrument with an optical port is usually used, also called a digital communication analyzer (DCA). If there is no optical port, use a large bandwidth photodetector (PD) to convert it into electricity and then look at the electric eye diagram. The eye diagram instrument can measure the eye diagram, and display OMA, ER, Pave and other parameters. We can just read it directly. However, it also depends on the margin of the transmitted optical eye diagram through the eye diagram template of the corresponding rate. As shown in the figure below, the gray area of the mask must not have signal samples falling into it.
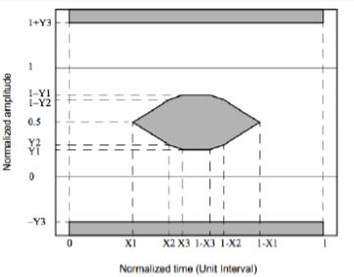
Figure 5 Example of Eye Diagram Mask
The test at the receiving end is different from that at the sending end. Generally, it is necessary to test a bad signal, also called a stress test, to evaluate the worst case. The electrical signal finally output by the receiver should also be tested, including eye diagram, BER, jitter, and tolerance of jitter tracking ability.
In practice, testing optical modules is a very complicated process. For different models, different rates, and different standards, the test indicators and methods are not exactly the same, and we should follow different test standards and procedures.