
What is an optical eye diagram?
The term “eye diagram” is often used in the analysis of optical communication tests. We can tell from its name that an eye diagram looks like a human eye. So, what is an optical eye diagram? The eye diagram is the result of accumulating and superimposing the bits of the collected serial signal in the way of oscilloscope afterglow. The shape of the superimposed figure looks like the shape of human eye. On the display of the oscilloscope, we can see an eye diagram that looks like an eye. As shown in the following figure:
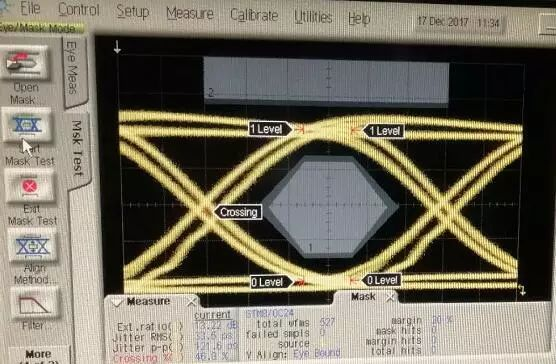
Figure 1: Optical eye diagram
Eye diagram is a series of digital signals accumulated and displayed on the oscilloscope. It contains rich information. From the eye diagram, we can observe the influence of inter-code crosstalk and noise, which embodies the overall characteristics of digital signals, and we can estimate the degree of system superiority and inferiority. Therefore, eye diagram analysis is the core of signal integrity analysis for high-speed interconnection systems.
How is optical eye diagram formed?
Why is the eye diagram formed? It is formed by the superimposition of a series of digital signals. The digital signals vary between high level and low level. Take a 3 -bit digital signal for example. It comes in 8 combinations:
000, 001, 010, 011, 100, 101, 110, 111
If these innumerable sequences are aligned to a reference point, and then the waveforms are stacked on top of each other, the principle is shown below.
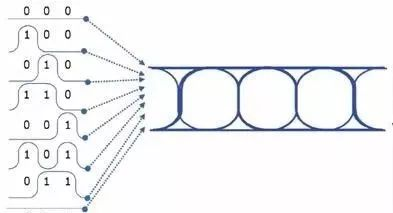
Figure 2: Schematic diagram of eye diagram
This is an ideal eye diagram with the “eye” wide enough. If the signal is not so good, there is noise or the inter-code crosstalk is very large, which will make the “eye” of the eye diagram smaller. The lines will become blurred.
What information can you get about the signal from the eye diagram?
- What does the thick line mean?
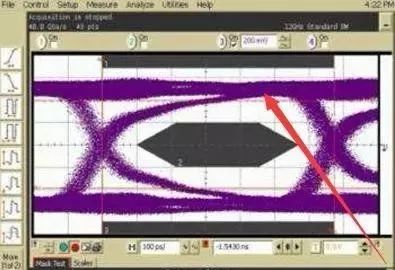
Figure 3: Schematic diagram of the thick line
As shown in the above, the thicker the line becomes, the stronger the signal noise and the inter -code crosstalk. The larger the “eye” is, and the more regular the eye diagram, the less the inter-code crosstalk of the signal. If there is noise in the signal, the “eye” will become smaller, and the original clear, regular eye diagram will become blurred and appear banded.
- What does eye height mean?
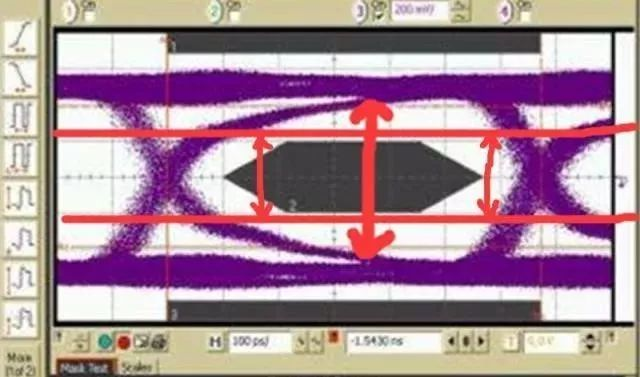
Figure 4: Schematic diagram of eye height
As you can see from the above picture, the higher the eye height, the better the signal. The two red horizontal lines are VIH and VIL, and the arrows on the left and right mark the moments when the signal changes from 0 to 1. The wider the two arrows, the closer the setup time and the hold time of the original signal. If the two arrows are small, the signals are incomplete, producing reflections, interference, and so on. This also reflects the noise tolerance of the signal.
Before and after sampling, the digital signal needs to have a certain setup time and hold time, and the digital signal should be stable during this period of time to ensure correct sampling. For the input level decision, the high voltage value is required to be higher than the VIH, and the low voltage value is required to be lower than the VIL. It can be seen from the above two red lines whether the eye diagram meets the requirements.
- What does eye width mean?
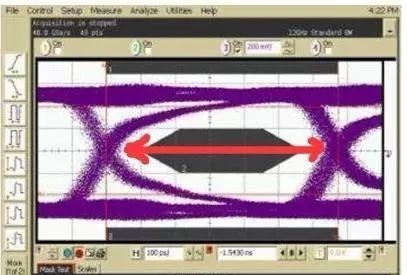
Figure 5: Schematic diagram of eye width
As you can see in the figure above, the red arrow indicates the eye width. When many signals are stacked together, the eye width is a good reflection of the stability time of the signal.
Since the eye diagram is a graph to completely represent the bit information of the serial signal, it has become the most important tool to measure the signal quality, and the eye diagram measurement is sometimes called” Signal Quality Test (SQ Test). ” In addition, whether the result of the eye diagram measurement is qualified or unqualified is usually relative to the “mask”. The mask specifies the tolerance of the serial signal “1” and “0” levels, and the tolerance of the rise and fall time.
Therefore, the eye diagram measurement is sometimes referred to as the “Mask Test”. Masks also come in a variety of shapes, and the usual mask for NRZ signals is shown in the middle black part of Figure 5 above. The mask of the eye diagram is different in different nodes of serial data transmission, so we should pay attention to the specific sub-mask type when selecting the mask.
If you use the sender’s mask as the receiver’s eye diagram mask, it may keep touching the mask. But the masks of some signals like Ethernet signal and E1/T1 signal are special, which are not NRZ code.
If a mask is encountered in the actual test, we analyze it reasonably and try to solve this problem. However, some products are not very demanding, allowing encounters with the mask in a small range. This is the trade -off between the designer’s pursuit of quality and adapting to market needs.
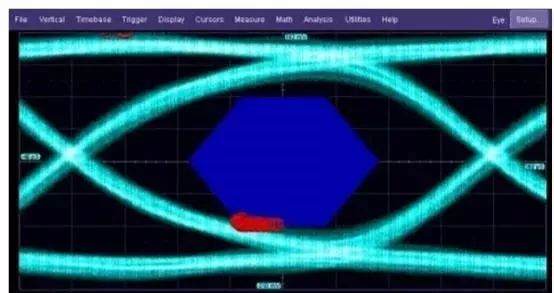
Figure 6
The problem in Figure 6 above is that the falling edge is so slow as to intersect with the mask, indicating that the load capacitance is too large, which slows the falling time.
Figure 7
The problem in Figure 7 is that there is a large ringing phenomenon, indicating incontinuous or mismatched impedance problems.
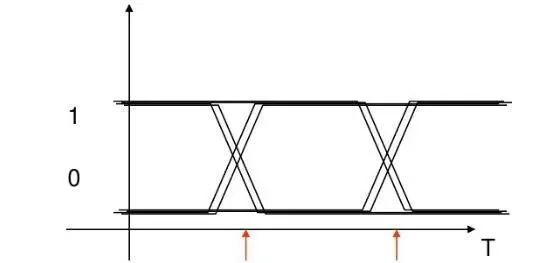
Figure8
This is double lines on the left and right, which may be a problem such as unstable clock signal.
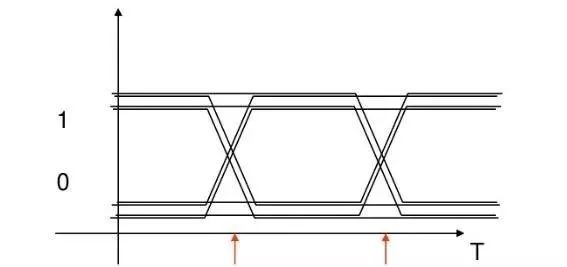
Figure 9
It is a full double line in Figure 9, which is caused by unstable modulation current or power control.
Advanced parameters
- Extinction ratio
The formula for the extinction ratio is as follows:
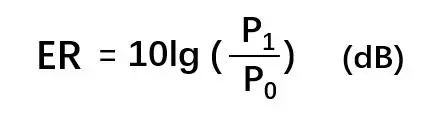
Formula 1
The extinction ratio is the ratio of the average value of 1 level to that of 0 level. The extinction ratio is a very important parameter in the measurement of optical communication transmitters. The larger it is, the clearer “0” and “1” signals can be obtained at the receiving end of the signal, and the better logic discrimination rate can be obtained.
- Eye-crossing percentage
The eye-crossing percentage represents the positional relationship between the intersection point and the one level and the zero level. As shown in the figure below:
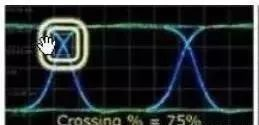
Figure 10: Eye-crossing percentage
This intersection is close to one level, which represents the ability of the signal to transmit one level or zero level. The more one level transmits, the closer the intersection approaches one level. And the more zero level transmits, the closer the intersection approaches zero level. The principle is shown in the following figure:
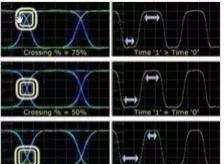
Figure 11: The relationship between different eye-crossing percentage and pulse signal
Figure 11 shows that if the crossover is on the top, one level is wider, and if the crossover is at the bottom, the zero level is wider. For general signals, evenly distributed signal levels 1 and 0 are the most common. It is generally required that the cross ratio of eye diagram is 50%, that is, the same length of signal pulses 1 and 0 are used as the standard to verify the relevant parameters. Therefore, the relative amplitude loss caused by the deviation of different 1 and 0 signal levels can be effectively measured according to the distribution of the eye-crossing percentage relation. If the eye-crossing percentage is too large, i.e., too many 1 -bit signals are transmitted, the signal error, masking, and limit values will be verified against this cross-percentage relationship. If the eye crossing percentage is too small, that is, too many 0 -level signals are transmitted, it will be hard for the receiving -end signals to extract the frequency from it, resulting in the inability to synchronize, and then produce synchronization loss.
- Q-factor
The formula for the Q factor is as follows:
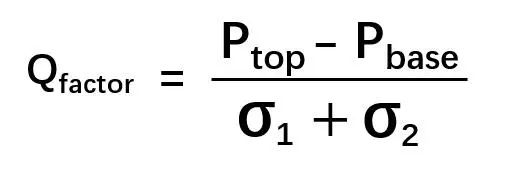
Formula 2
The numerator is the difference between the mean value of 1 level and 0 level, which is the eye amplitude. The denominator is the sum of the significant values of noise at 1 level and 0 level; This Q-factor represents the quality of the signal. The higher the Q-factor, the better the signal -to-noise ratio, the better the signal.
The Q factor is generally affected by noise, optical power, and whether the electrical signal is impedance-matched from the beginning to the end.