

As AI infrastructure evolves toward increasingly large GPU clusters, optical interconnect reliability is becoming a critical factor in overall computing performance. Modern AI data centers rely on thousands or even hundreds of thousands of optical links connecting GPUs, switches, NICs, and storage systems. A single unstable link can introduce retransmissions, trigger link flapping, or disrupt synchronized communication across an entire cluster.
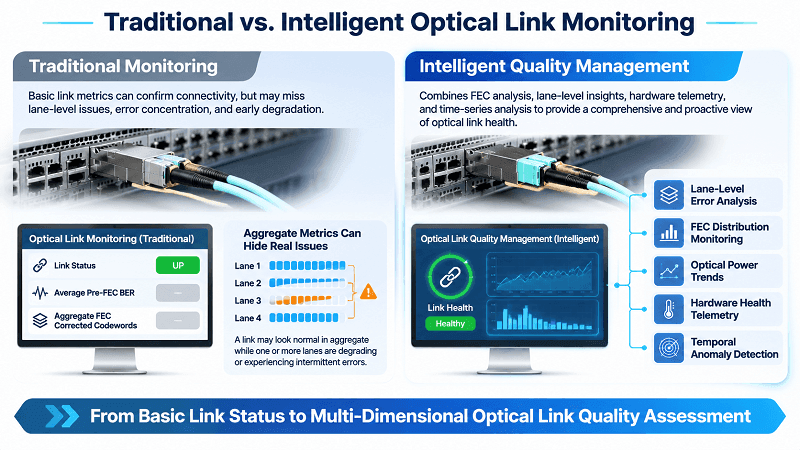
Traditional optical link monitoring, which primarily relies on link status, optical power, and average Bit Error Rate (BER), is no longer sufficient to identify every potential failure before it affects production workloads.
Optical interconnect quality management requires a more comprehensive approach: analyzing Forward Error Correction (FEC) behavior, monitoring error distributions, detecting abnormal patterns, and correlating physical-layer telemetry with network topology and hardware information.
By combining Maximum FEC Distribution (MFD), AI-powered monitoring, digital probes, and digital twin technologies, network operators can move from reactive troubleshooting toward proactive optical link quality assurance.
Why Traditional Link Quality Metrics Fail in AI Networks
Traditional optical monitoring was largely designed to determine whether an optical link could establish and maintain a connection. However, AI clusters introduce a different set of operational challenges.
In distributed AI training, GPUs frequently exchange large volumes of synchronized data through collective communication operations such as All-Reduce. When one optical path experiences intermittent errors or degraded signal quality, the resulting communication delays can affect multiple endpoints and reduce overall cluster efficiency.
Several limitations make conventional monitoring insufficient.
1. Link Status Only Identifies Complete Failures
A link reporting UP does not necessarily mean that it is operating reliably.
An optical connection may remain active while experiencing increasing FEC corrections, intermittent burst errors, or lane-level signal degradation. These conditions can remain undetected until the link approaches its error-correction limit.
2. Average BER Can Hide Localized Problems
Pre-FEC BER measures the bit error rate before forward error correction. It is useful for evaluating signal quality, but an average value may not fully represent how errors are distributed across individual lanes and FEC codewords.
Two links with similar average pre-FEC BER can exhibit different error patterns. One may have relatively uniform random errors, while another experiences concentrated bursts of errors.
These patterns can create different levels of risk for the FEC decoder.
3. FEC Counters Do Not Always Reveal the Full Error Distribution
FEC corrected-codeword counters indicate how much error correction is occurring. However, a single aggregate counter does not necessarily reveal whether errors are evenly distributed or concentrated in a small number of heavily affected codewords.
A link may continue transmitting successfully while its correction margin gradually decreases.
4. Periodic Monitoring Can Miss Transient Events
Short-duration electrical disturbances, connector contamination, unstable components, and environmental changes can produce intermittent errors.
If monitoring intervals are too long, important events may disappear between measurement points.
For AI data centers, these limitations make it necessary to move beyond simple link-state monitoring toward continuous, multi-dimensional optical interconnect quality management.
Redefining Optical Link Quality: The MFD Metric
A more effective approach to optical link quality management is to examine not only how many errors occur, but also how those errors are distributed.
Maximum FEC Distribution (MFD) provides an additional perspective on FEC correction behavior by focusing on the distribution of correction activity rather than relying exclusively on average BER or aggregate error counts.
It can help identify abnormal error concentrations, highlight links with potentially limited correction margin, and support earlier investigation.
What Is Maximum FEC Distribution (MFD)?
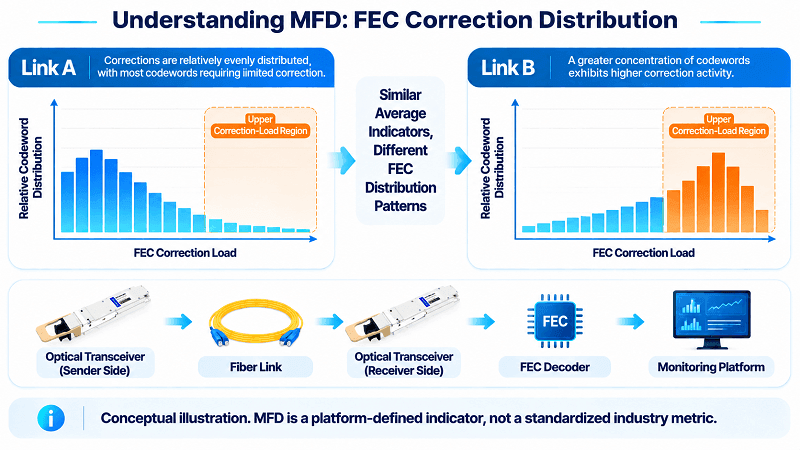
Maximum FEC Distribution (MFD) is a platform-specific optical link quality indicator used to describe the distribution of FEC correction activity, particularly the upper end of correction-load patterns.
Traditional monitoring often focuses on average pre-FEC BER or total corrected-codeword counts. While these indicators are useful, they may not fully reveal how correction activity is distributed across FEC codewords and individual optical lanes.
For example, consider two optical links:
- Link A: FEC corrections are distributed relatively evenly across codewords, with most codewords requiring limited correction.
- Link B: The average correction level appears similar, but a greater concentration of codewords exhibits higher correction activity.
Although their average error indicators may look comparable, Link B may have less remaining correction margin and a higher risk of encountering uncorrectable errors under additional signal degradation.
Analyzing FEC distribution can help expose this difference.
Its value comes from examining several aspects of link behavior:
- FEC correction distribution across codewords.
- Lane-level error concentration.
- Changes in correction patterns over time.
- Differences between normal operating baselines and abnormal conditions.
It is important to distinguish MFD from standardized optical performance measurements. MFD is not a universally standardized IEEE, OIF, or ITU-T metric. Its precise calculation, observation window, and alert thresholds depend on the monitoring platform and FEC implementation.
When used alongside standardized pre-FEC BER, post-FEC performance, and FEC error counters, MFD can provide additional insight into optical link health.
The Eagle Eye: Catching Hardware Quality Risks Before Deployment
Optical link reliability starts before hardware enters the production network.
In large AI infrastructure deployments, hundreds or thousands of optical transceivers and connectivity components may be purchased, tested, and installed across different production batches.
A small number of abnormal units can create disproportionate operational risks.
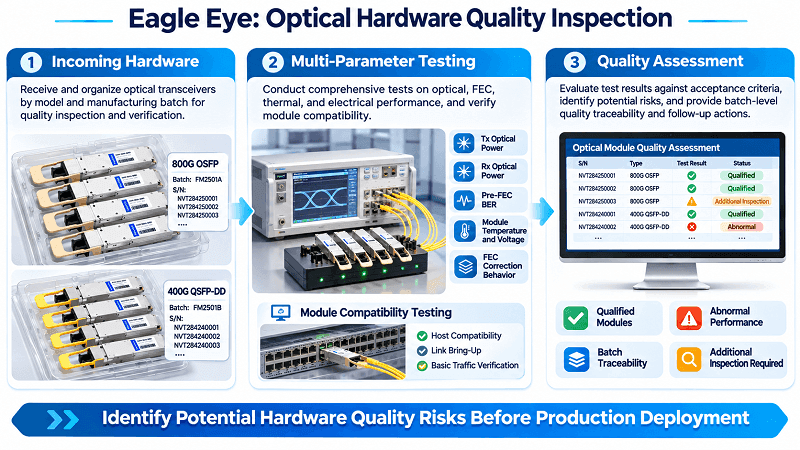
The Eagle Eye approach focuses on identifying potential hardware quality issues during incoming inspection and pre-deployment qualification.
It can combine:
- Optical transmit and receive power measurements.
- Module temperature and voltage.
- Laser bias current.
- Pre-FEC BER and FEC correction behavior.
- Lane-to-lane performance consistency.
- Module firmware and hardware identification.
- Host platform and interoperability information.
- Manufacturing batch and serial-number traceability.
By comparing individual modules against established acceptance criteria and historical batch baselines, quality teams can identify abnormal devices before they enter production.
For example, if several modules from the same manufacturing batch exhibit unusually high FEC correction activity under comparable test conditions, the batch can be flagged for additional inspection.
This approach helps reduce the risk of deploying marginal hardware and makes optical component quality management more systematic.
The Radar: Early Warning of Burst-Error Risk in Live Networks
Hardware qualification alone cannot guarantee long-term link stability.
Optical links operate under changing temperatures, electrical conditions, traffic patterns, and physical environments. A link that passes initial acceptance testing may still develop problems after deployment.
The Radar approach provides continuous monitoring of live optical connections.
Instead of waiting for a link-down event, it analyzes changes in:
- FEC corrected and uncorrected codeword rates.
- FEC histogram distribution.
- Pre-FEC BER.
- Receive optical power.
- Module temperature and bias current.
- Lane-level error concentration.
- Link flapping and CRC error events.
The objective is to detect abnormal trends and short-duration error bursts before they develop into persistent link failures.
For example, a gradual increase in high-correction FEC bins combined with declining receive power may indicate an optical-path problem.
Similarly, sudden error spikes across multiple lanes may suggest an electrical or environmental disturbance.
By correlating these signals, Radar can generate early warnings that help network operators investigate potential issues while the link is still operational.
AI-Powered Monitoring and Intelligent Fault Analysis
As optical networks grow, manually analyzing individual transceiver readings and switch counters becomes increasingly difficult.
AI-powered monitoring introduces automated analysis, anomaly detection, predictive modeling, and intelligent fault correlation.
The goal is not simply to generate more alarms. It is to identify meaningful patterns, determine where a problem originates, and help engineers take corrective action more efficiently.
AI-Driven Multi-Dimensional Fault Prediction
Optical link failures rarely have a single universal indicator.
A degrading connection may exhibit changes in optical power, FEC correction activity, temperature, voltage, or lane-level performance before an obvious failure occurs.
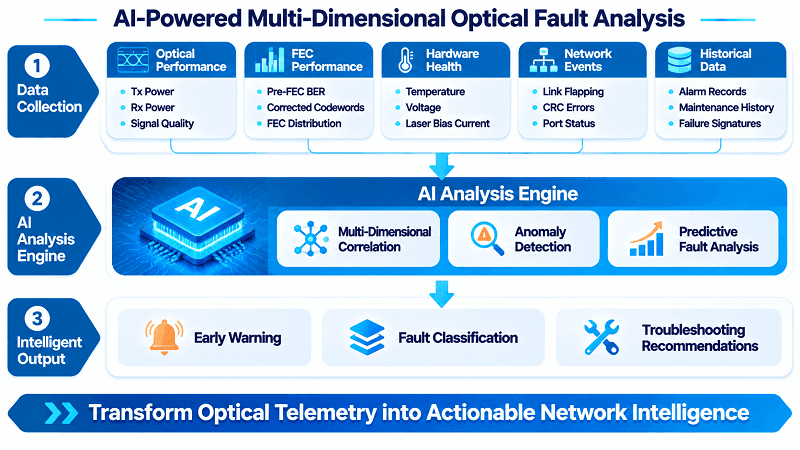
AI-driven fault prediction combines these different data sources to identify abnormal behavior.
A multi-dimensional monitoring model can analyze:
- Optical Performance: Tx power, Rx power, and available signal-quality indicators.
- FEC Performance: Pre-FEC BER, corrected codewords, uncorrectable codewords, and FEC distribution.
- Hardware Health: Temperature, voltage, bias current, and device operating history.
- Network Behavior: Link flapping, CRC errors, port status, and traffic-related events.
- Historical Patterns: Previous alarms, maintenance records, and known failure signatures.
Machine learning models can establish normal operating baselines, identify deviations, and forecast potential performance deterioration.
For example, an optical module may still operate within its alarm thresholds, but its temperature and bias current may show a sustained abnormal trend while FEC correction activity increases.
Analyzing these signals together can provide an earlier indication of possible hardware degradation than monitoring any single parameter independently.
Prediction confidence and false-positive rates should also be tracked to ensure that alerts remain actionable.
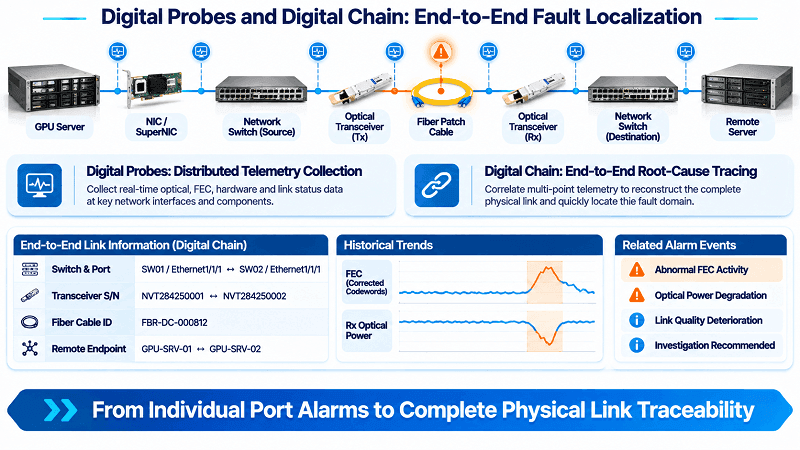
Digital Probes: Second-Level Fault Localization
When an optical link becomes unstable, identifying the exact source of the problem is often more difficult than detecting the failure itself.
Digital Probes provide distributed monitoring points throughout the network.
They collect operational data from relevant interfaces and components, helping engineers narrow down the location of abnormal behavior.
Depending on the available monitoring interfaces, probes can capture:
- Switch-port status and interface counters.
- Transceiver DOM and CMIS telemetry.
- Lane-level FEC statistics.
- Pre-FEC BER and error events.
- Cable and connection information.
- Historical performance changes.
With sufficiently frequent telemetry collection and event processing, the system can support seconds-level fault localization.
For example, when a 400G or 800G optical connection develops abnormal errors, digital probes can help determine whether the problem is concentrated in one optical lane, associated with a particular transceiver, or related to the switch-side interface.
This reduces the need for engineers to manually inspect every component along the connection.
Digital Chain: End-to-End Root-Cause Tracing
An optical link is part of a larger physical and logical connectivity chain.
A typical connection may include:
- GPU or server network interface.
- NIC or SuperNIC.
- Switch ASIC and switch port.
- Optical transceiver.
- Fiber patch cable.
- MPO or LC connectivity.
- Remote transceiver and receiving interface.
A fault detected at one point may originate from another component elsewhere in the connection.
Digital Chain technology correlates monitoring data with hardware inventory and network topology to reconstruct the complete connection path.
For example, if an optical link experiences repeated errors, the system can correlate:
- The affected switch and interface.
- The connected transceiver and serial number.
- The corresponding fiber cable and remote endpoint.
- Historical FEC and optical power changes.
- Related alarms and previous maintenance records.
This provides engineers with a more complete view of the failure rather than an isolated alarm.
Potential root causes may include connector contamination, fiber damage, transceiver degradation, incorrect FEC configuration, firmware incompatibility, or host-side signal-integrity issues.
The result is more structured troubleshooting and better traceability across complex AI network infrastructures.
Digital Twin: Visual Assessment and DSP Tuning Guidance
A Digital Twin extends optical monitoring from fault detection to network-level visualization and engineering analysis.
By creating a virtual representation of the physical optical network, engineers can visualize connections, device relationships, link conditions, and abnormal operating patterns.
A digital twin can support several important functions:
Network Visualization
Display the physical and logical connectivity between switches, servers, transceivers, and optical links.
Real-Time Health Assessment
Associate live telemetry and historical performance data with individual connections to highlight abnormal components and degraded paths.
Scenario Simulation
Evaluate how potential configuration changes, component replacements, or network topology adjustments may affect overall connectivity.
DSP Tuning Guidance
Use available DSP telemetry and signal-quality information to help engineers evaluate equalization settings and other supported signal-processing parameters.
Any recommended DSP changes should remain within vendor-defined operating limits and be validated before production deployment.
By combining visualization, simulation, and engineering guidance, digital twins can help operators understand not only where a problem exists, but also how potential corrective actions may affect the wider network.
What This Means for Your AI Data Center
For AI infrastructure buyers, optical interconnect quality management should be considered during component selection, procurement, qualification, and long-term network operation.
Choosing an optical transceiver based only on bandwidth, reach, and price is no longer sufficient for demanding AI workloads.
The following considerations can help improve deployment reliability.
Select Optics Based on the Complete Network Architecture
Choose optical transceivers according to the switch platform, NIC, transmission distance, fiber type, and required bandwidth.
For example, 400G and 800G AI networks may use different combinations of QSFP-DD and OSFP transceivers, depending on the network architecture.
Ensure that the selected modules match the host interface and supported optical specifications.
Verify FEC Compatibility and Monitoring Capabilities
FEC compatibility is essential for high-speed optical connections.
Before deployment, confirm:
- Supported FEC modes on both connected endpoints.
- Compatibility between the switch ASIC and optical transceiver.
- Availability of pre-FEC BER and relevant FEC counters.
- Lane-level monitoring capabilities.
- CMIS and VDM diagnostic support where applicable.
- Firmware and host-platform interoperability.
Not every module or host exposes the same diagnostic information. Monitoring capabilities should therefore be verified for the actual hardware combination.
Request Hardware Qualification and Test Documentation
For large procurement projects, incoming inspection should include more than basic optical power measurements.
Buyers should request relevant qualification records, such as:
- Transmitter optical power.
- Receiver sensitivity.
- Pre-FEC BER and FEC performance.
- Temperature and voltage operating ranges.
- Module interoperability results.
- Serial-number and batch traceability.
These records help establish a baseline for hardware acceptance and subsequent troubleshooting.
Do Not Overlook Fiber Connectivity
Optical transceiver performance depends on the complete optical path.
Contaminated connectors, damaged fiber, excessive insertion loss, incorrect polarity, and poor cable management can all affect link reliability.
Appropriate MPO and LC fiber inspection, cleaning, and testing should be part of the deployment process.
Build a Long-Term Optical Maintenance Strategy
After installation, establish baseline measurements for each optical link.
Monitor changes in FEC correction activity, optical power, temperature, and error events over time.
When abnormal trends appear, investigate the affected connection before the problem develops into a production outage.
For AI data centers deploying 400G and 800G connectivity, FiberMall provides optical transceivers, DAC and AOC cables, fiber patch cords, and related connectivity solutions.
Selecting the right components, validating host compatibility, and maintaining reliable optical connections are essential steps toward building a stable and scalable AI network.
Frequently Asked Questions (FAQ)
What Is Optical Interconnect Quality Management?
Optical interconnect quality management is the process of monitoring, evaluating, and maintaining the performance and reliability of optical connections in a network.
It includes optical power monitoring, BER analysis, FEC statistics, transceiver diagnostics, hardware qualification, and fault analysis.
In AI data centers, it helps identify potential link degradation before it affects GPU communication and cluster performance.
Why Is Pre-FEC BER Not Enough to Evaluate Optical Link Quality?
Pre-FEC BER measures the error rate before forward error correction.
Although it provides useful information about signal quality, it does not fully describe how errors are distributed across FEC codewords or optical lanes.
Two links with similar average pre-FEC BER may have different error distributions and correction margins.
Combining pre-FEC BER with FEC histograms, corrected-codeword rates, and lane-level telemetry provides a more comprehensive assessment.
What Is Maximum FEC Distribution (MFD)?
Maximum FEC Distribution (MFD) is a platform-specific metric for evaluating the distribution of FEC correction activity, particularly higher correction-load patterns.
It helps identify potential error concentration and reduced correction margin.
MFD complements conventional BER and FEC counters rather than replacing standardized optical performance measurements. Its precise definition depends on the monitoring platform and FEC implementation.
How Can AI Predict Optical Link Failures?
AI can analyze historical and real-time optical telemetry to identify abnormal patterns and predict potential link degradation.
Typical input data includes optical power, temperature, bias current, pre-FEC BER, FEC correction statistics, and interface events.
By learning normal operating behavior and detecting deviations, machine learning models can help engineers investigate potential failures before they cause significant network disruption.
What Should Be Monitored in 400G and 800G Optical Interconnects?
For 400G and 800G optical connections, important monitoring parameters include:
- Transmitter and receiver optical power.
- Pre-FEC BER.
- FEC corrected and uncorrected codewords.
- FEC error distribution and lane-level statistics, where available.
- Module temperature and voltage.
- Laser bias current.
- Link status, CRC errors, and link flapping.
Monitoring these parameters together provides better visibility into optical link health and helps support reliable high-speed connectivity.
Conclusion
As AI clusters continue to scale, optical connectivity is becoming an increasingly important part of overall computing infrastructure reliability.
Traditional link-state monitoring and average BER measurements cannot fully describe the operational condition of increasingly complex optical networks.
A more advanced approach combines MFD-based FEC distribution analysis, hardware qualification, continuous telemetry, AI-driven fault prediction, and end-to-end root-cause tracing.
By integrating these capabilities, optical interconnect quality management can help network operators identify degradation earlier, reduce troubleshooting complexity, and maintain more reliable connectivity across large AI data centers.
For organizations building next-generation AI infrastructure, reliable optical interconnects are not simply a hardware requirement. They are a foundation for scalable and efficient AI computing.