
A link runs clean for two years. Then one Tuesday, two edge channels start throwing errors while the other thirty-eight remain healthy. The amplifier raises an alarm, so someone replaces it. The errors return a week later because the amplifier was never the problem.
That sequence is common enough to be familiar. An alarm appears on the last device in the chain, the engineer replaces that device, and the actual fault remains undetected several hundred meters along the fiber.
Good DWDM troubleshooting works the other way around. You take measurements that help distinguish between possible causes, then use the results to decide where to investigate. That is a discipline, not a talent, and it can be learned.
This DWDM troubleshooting guide covers four key measurements, a fault tree that maps symptoms to first checks, and six common faults with practical diagnostic steps. If you are dealing with an active incident, our optical engineers can help you work through the sequence.
DWDM Troubleshooting Starts With One Question
DWDM troubleshooting is the process of isolating a fault in a wavelength-division multiplexed link by measuring optical signals at defined points and comparing the results with the system design and a recorded baseline. The choice and order of measurements should be guided by the symptoms and network topology.
The question underneath all of it is short: What changed, and what can I measure to find out?
Most teams skip the second half. They ask what changed, guess at an answer, and start swapping parts. But “what changed” is often difficult to establish. Nobody records the maintenance visit that replaced a patch cord, the firmware update that reset a gain value, or the splice work carried out in a manhole two months earlier.
So measure the link instead. A measurement shows its current state; comparing that result with a reliable baseline helps reveal what may have changed.
One more thing before the instruments come out. DWDM alarm names and codes are vendor-specific, and an alarm alone does not identify the root cause. Similar physical symptoms may appear as LOS-P, APWR-LOW, or SPANLOSS-OUT-OF-RANGE, depending on the platform. Cisco’s alarm reference, for example, documents numerous product-specific alarm conditions.
Treat an alarm as a clue about where to investigate, not as a diagnosis. The DWDM complete guide covers the underlying architecture if you need a refresher.
The Four Measurements That Diagnose Many Common Faults
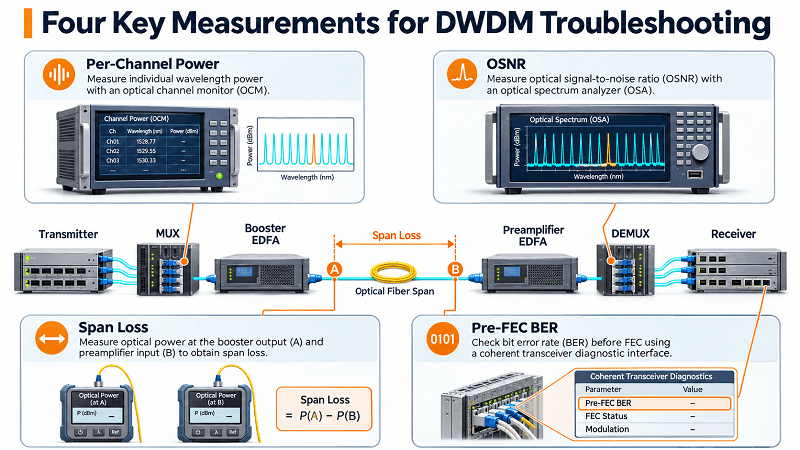
Four measurements help resolve many common DWDM faults. They do not identify every fault on their own, and they should not always be taken in a fixed sequence. Start with the measurement that best distinguishes between the likely causes indicated by the symptom.
| Measurement | What it tells you | Healthy range or reference | What it helps investigate |
| Per-channel power | Whether each channel is present and operating at the expected level | Within the system design and transceiver specifications; channel-to-channel variation should match the planned power profile | Channel-specific or common-path power problems, mux/demux ports, amplifier gain and incorrect optics |
| OSNR | Signal quality relative to optical noise | Above the receiver or system requirement, measured using the specified reference bandwidth and method | ASE accumulation, amplifier noise figure, span loss and filter-related penalties |
| Pre-FEC BER | Error rate before forward error correction; an indicator of signal quality and FEC margin | Within the applicable transceiver/FEC specification and stable over time | Degradation that may not yet produce uncorrectable errors |
| Span loss | Optical loss between defined reference points | Within the link budget and consistent with the commissioning baseline | Excess loss caused by connectors, splices, bends, damaged cable or passive components |
Per-Channel Power
Start with channel power when the symptom suggests that one or more wavelengths may be missing or operating at an unexpected level. An optical channel monitor (OCM) can monitor channel power across the DWDM band.
You are looking for two things: absolute power and spectral flatness. For example, a channel that sits several dB below its neighbors may indicate a channel-specific issue, such as a transceiver, mux/demux port, filter path or patch connection. If all channels are low by a similar amount, investigate the common path, amplifier settings, total launch power and measurement reference. This comparison helps narrow the list of suspects, but power readings alone do not prove the root cause.
OSNR
Optical signal-to-noise ratio (OSNR) compares the power of the optical signal with the noise power in a defined reference bandwidth. It helps identify signal-quality degradation that may appear before traffic errors become visible.
Do not apply a universal target. The required OSNR depends on the modulation format, symbol rate, FEC scheme, receiver implementation, channel frequency and measurement method. The reference bandwidth also matters; many conventional DWDM OSNR specifications use a 0.1 nm reference bandwidth.
For example, ITU-T G.698.2 specifies application-dependent OSNR parameters for 100G DP-DQPSK interfaces. At 193.6 THz and a 0.1 nm reference bandwidth, its narrow-spectral-excursion application codes specify a minimum OSNR of 21 dB and a receiver OSNR tolerance of 16 dB. The corresponding values for the wide-spectral-excursion application codes are 24 dB and 19 dB. These are values for the specified application codes, not universal thresholds for every 100G system.
The current edition of G.698.2 covers DWDM single-channel interfaces up to 100 Gbit/s; it should not be used as the source of a 400G 16QAM threshold. For 400G coherent links, use the applicable implementation agreement, transceiver specification and system design. The engineering margin should also come from the link design rather than from a universal 3–4 dB rule.
Pre-FEC BER
This is a measurement many teams underuse, and it can help make DWDM troubleshooting more predictive.
Pre-FEC BER is the bit error rate measured before forward error correction is applied. It provides an indication of signal quality and how much correction capability the selected FEC scheme may need.
Post-FEC BER is measured after FEC decoding. It is not simply binary: equipment can report a numerical post-FEC BER, along with corrected and uncorrected codeword or block counts. A zero post-FEC BER reading does not mean that the link has unlimited margin; the pre-FEC BER and FEC correction statistics provide additional information.
There is no universal set of Pre-FEC BER values that means “safe,” “comfortable” or “near failure” for every DWDM system. The applicable threshold depends on the modulation format, FEC scheme and transceiver implementation. Compare the measured value with the equipment specification and monitor its trend over time.
A rising Pre-FEC BER can indicate that the link is losing margin even while traffic remains error-free. Monitoring both pre-FEC and post-FEC performance, together with FEC correction counters, gives a more complete view than relying on post-FEC alarms alone.
Span Loss
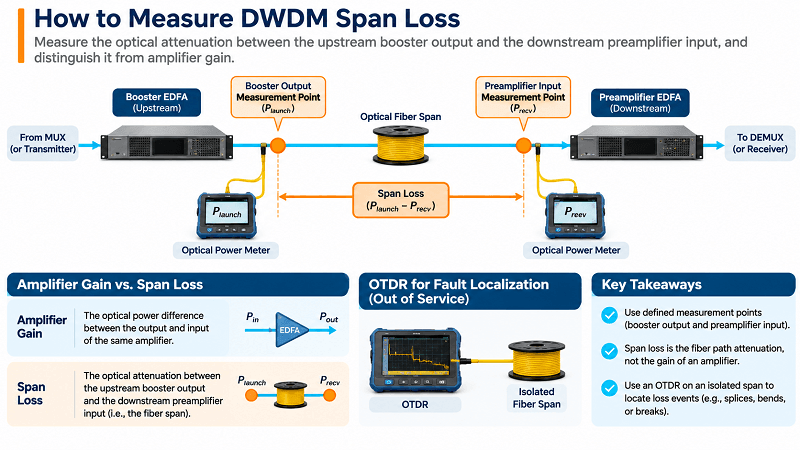
Span loss describes the optical attenuation between defined points in the fiber path. It can be measured with a calibrated light source and optical power meter when the span is safely isolated for testing. On an operating amplified DWDM link, use approved in-service measurements and monitoring points.
Be careful when reading amplifier power values. The difference between an amplifier’s output and input power is its gain; it is not, by itself, the loss of the fiber span. For an amplified link, span loss is generally assessed by comparing the upstream booster output with the downstream preamplifier input, using the correct reference points and accounting for the measurement method.
Compare the result with the design value and commissioning baseline, not with a generic target. A 19 dB span may be acceptable if the design specified 19 dB, while the same measurement may indicate a problem if the baseline was 15 dB. That is why the DWDM network design and link budget still matter years after commissioning. Keep the reference points, test wavelength, direction and instrument method consistent when comparing measurements.
The Fault Tree: What Is Actually Wrong?
Start with the symptom, not just the alarm and not the device you suspect.
| Symptom | Possible causes | First check |
| One channel down, others healthy | Transceiver, patch connection, mux/demux or WSS port, wavelength assignment or channel-specific filter issue | Check channel presence and per-channel power; verify the wavelength, port mapping and readings at both ends |
| All channels down on one span | Fiber cut, disconnected patch, loss of amplifier power or amplifier failure | Check LOS at both ends, amplifier input/output status and span attenuation |
| Edge channels fail, mid-band healthy | Gain tilt, WSS passband limits, cascaded filter narrowing or channel-dependent path loss | Sweep the spectrum and review amplifier equalization and filter passbands |
| All channels show low OSNR | ASE accumulation, amplifier noise figure or operating point, excessive span loss, or insufficient signal power | Compare OSNR and optical power at relevant amplifier and receiver reference points |
| Errors with normal power levels | Low OSNR/SNR, dispersion, PMD, nonlinear effects, FEC configuration or transceiver issues | Review Pre-FEC BER, OSNR/SNR and available dispersion or module telemetry together |
| Intermittent, temperature-correlated errors | Contaminated or loose connector, mechanical movement, or temperature-related drift in a module or amplifier | Review temperature and power logs, then inspect the end faces and patch connections |
Two broad patterns are especially useful. If one channel fails while its neighbors remain healthy, start with channel-specific components and wavelength-dependent effects. If all channels fail together, investigate the common path before replacing an individual card. This distinction can reduce DWDM fault finding to a much shorter list of likely causes, although it does not rule out every shared-path or filter-related issue.
The Six Faults and Their Typical Repair Effort
Many DWDM troubleshooting guides sort faults by severity. A more practical approach is to eliminate simple, low-cost causes before committing to hardware replacement or cable work. Actual repair costs vary with the network design, site access, equipment and service requirements, so the order below is a troubleshooting sequence rather than a universal cost ranking.
1. Contaminated Connectors: A Quick, Low-Cost First Check
Connector contamination is a common and often inexpensive cause of optical link degradation. It should be checked early in a DWDM troubleshooting sequence because contamination can be difficult to see without suitable magnification.
Rafael found out the hard way. During a scheduled maintenance visit, a patch cord was replaced as a precaution, but the replacement was inserted with a contaminated ferrule. Nothing failed that day.
Three days later, the additional insertion loss had reduced the system margin, and the two edge channels were the first to cross their error threshold. The spectrum initially suggested an amplifier problem. Inspection found the contamination in under a minute, and cleaning restored the connection in about ninety seconds.
Contamination does not always appear as a simple, steady loss increase. A marginal connection may cause intermittent errors, and temperature-related changes in connector contact or nearby equipment can make the symptoms appear at particular times. However, temperature correlation alone does not prove that contamination is moving across the fiber core. Confirm the cause through inspection and measurement.
“It looks clean” is not an inspection. IEC 61300-3-35:2022 defines procedures and quantitative criteria for inspecting fiber-optic connector and fiber-stub transceiver end faces for debris, scratches and defects. The standard also makes clear that visual inspection supplements, but does not replace, optical performance measurements such as attenuation and return loss.
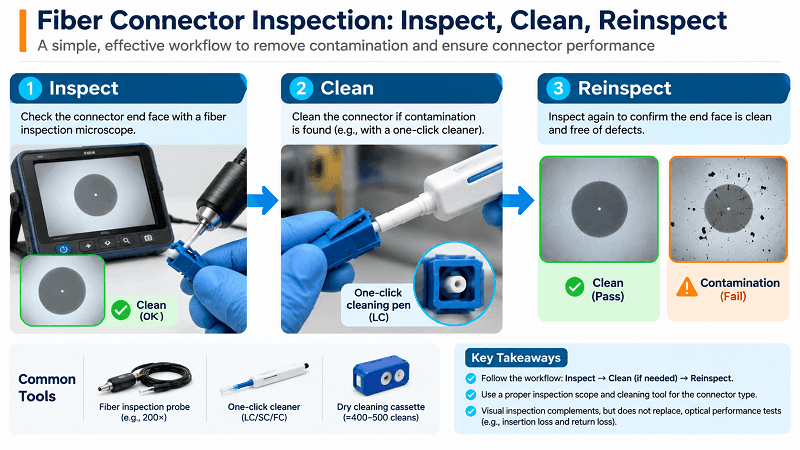
Practically, that means you need suitable magnification and the knowledge to interpret the inspection image. FiberMall supplies inspection and cleaning products, including a 5 MP, 200× fiber end-face inspection probe listed at $2,495 and one-click cleaning pens from $50, depending on connector type. Confirm current product pricing before publication.
A dry cleaning cassette listed at $31–$49 can handle routine cleaning, with a stated capacity of approximately 400 to 500 operations per unit. Keep cleaning supplies readily available near patch panels and other frequently accessed connection points.
Follow the correct sequence: inspect the end face, clean it if necessary, and inspect it again. Follow the connector and cleaning-tool manufacturer’s instructions, and do not rely on cleaning alone as proof of optical performance.
2. Span Loss Out of Range: Locate the Loss Before Re-splicing
When measured span loss exceeds the design value, something in the optical path may have changed. Possible causes include a contaminated or damaged connector, a poor splice, a bend, damaged cable or an added passive component.
First confirm that the current measurement uses the same reference points, wavelength, direction and method as the design or commissioning measurement. Then compare the measured loss with the baseline and investigate the difference.
Do not identify a connector, splice or cable cut from the total loss increase alone. A 1–2 dB increase does not automatically mean a connector is responsible, and a 3–5 dB increase does not prove a splice fault. Use connector inspection, segmented power measurements and an OTDR trace to locate and characterize loss events. For an active DWDM link, use an approved test arrangement that will not expose equipment to an unsafe optical signal or interrupt service unexpectedly.
This is what makes span-loss measurement useful: it quantifies the change, while follow-up tests help locate its source.
3. Amplifier Gain and Tilt: Verify Before Replacing Hardware
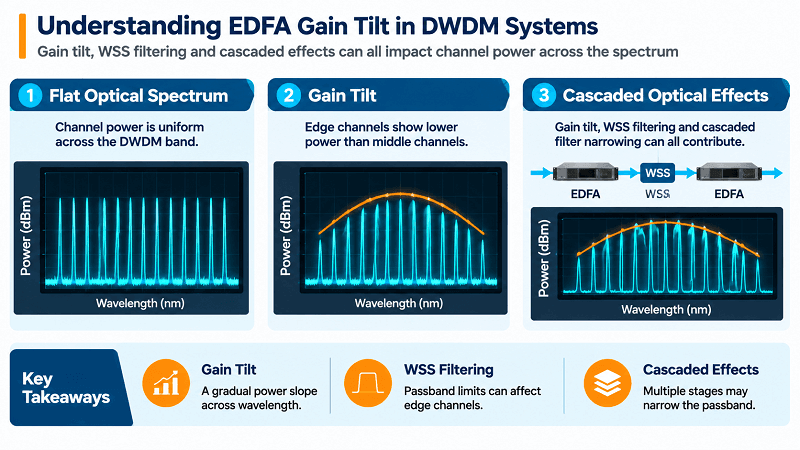
Amplifiers can fail, but configuration errors, saturation, gain tilt and channel-loading changes can also cause problems. Check the operating state and configuration before assuming that the amplifier hardware is defective.
Owen’s team replaced the same amplifier twice before anyone reviewed its configuration. The gain setpoint had been left at a test value after commissioning. When the channel load changed, the amplifier and its control loop did not maintain the intended power profile. The hardware itself was not the root cause.
Edge channels failing while mid-band channels remain healthy can indicate gain tilt, but it is not the only possible explanation. WSS passband limits, cascaded filter narrowing and wavelength-dependent path loss can produce similar symptoms. Each amplifier and filter stage can contribute to the overall spectral profile, and these effects may accumulate across a cascade. The amount depends on the equipment, configuration and channel plan; there is no universal 0.5 dB contribution per amplifier.
Review the actual gain setpoints, tilt settings, output power, channel loading and transient behavior. Compare them with the commissioning record. The DWDM amplifier guide covers gain, noise figure and amplifier operation in more detail.
4. Wavelength Collision: Check the Channel Plan
Two transmitters assigned to the same wavelength on the same optical path can interfere with each other and cause errors that resemble a faulty optic. A stale channel record is one possible cause: a service may have been re-provisioned without the documentation being updated.
Compare the provisioned channel plan with the actual transmitter frequency, route and mux/demux port assignments. Use an OCM or optical spectrum analyzer to confirm that the expected channels and spectral positions are present. An OCM can help verify channel occupancy, but it may not independently identify two co-channel transmitters as separate sources.
The DWDM channel plan guide explains channel spacing and wavelength planning.
5. Transceiver and Reach Mismatch: Verify Compatibility
A wrong reach rating, fiber type, wavelength, modulation format or module specification can prevent a link from operating as designed. A module may also be incompatible with the host platform, firmware, FEC mode or optical link budget.
These problems often appear during initial turn-up or after a module replacement or configuration change, rather than as gradual degradation. However, a compatibility issue can also emerge after a network change, so check the actual part number and operating parameters against the design.
The DWDM transceiver guide covers reach ratings and tunable versus fixed optics.
6. Fiber Plant: Test Before Replacing Cable
Fiber-plant issues include macrobends, damaged sections, poor splices, fiber breaks, chromatic dispersion and polarization mode dispersion (PMD). Some can be expensive to repair, particularly when cable replacement or difficult site access is required. However, not every dispersion or attenuation issue requires a cable replacement.
Use the test that matches the suspected fault. An OTDR can help locate breaks, bends, splice events and other localized loss or reflection events. Chromatic dispersion and PMD require appropriate dispersion test equipment or supported coherent-transceiver diagnostics; an OTDR trace alone does not measure these parameters.
Do not begin by ordering a cable replacement. First use power, OSNR/SNR, BER and other available measurements to establish whether the fiber plant is implicated. Then perform targeted tests under an approved procedure. The goal is to avoid expensive work before the evidence supports it, not to delay a necessary fiber test.
The Six Faults at a Glance
| Fault | Typical repair effort | First check |
| Contaminated connector | Usually low; cleaning consumables and inspection equipment may be required | Inspect the end face, clean if necessary, and reinspect |
| Span loss out of range | Varies; may require a splice crew and a maintenance window | Measure span loss against the design and commissioning baseline |
| Amplifier gain and tilt | Often a configuration change; hardware repair may be needed in some cases | Compare gain and tilt settings with the commissioning record |
| Wavelength collision | Often a provisioning or channel-plan correction | Compare the channel plan with transmitter frequencies and OCM/OSA results |
| Transceiver or reach mismatch | Module replacement or configuration correction | Confirm the part number and operating parameters against the design |
| Fiber plant | Potentially high if cable repair or replacement is required | Use OTDR for localized events and dedicated tests for CD/PMD |
Commissioning Is Where DWDM Troubleshooting Is Won
Here is the uncomfortable part. DWDM troubleshooting is often difficult not because the diagnosis is impossible, but because nobody recorded what a healthy link looked like.
Hana inherited a regional span with no commissioning records. Span loss measured 19 dB. Was that the design value, or four decibels of degradation accumulated over three years? The measurement alone could not answer the question.
It took two days, a borrowed OTDR and a call to the previous operator to establish that 19 dB had always been the baseline. The fault was somewhere else entirely.
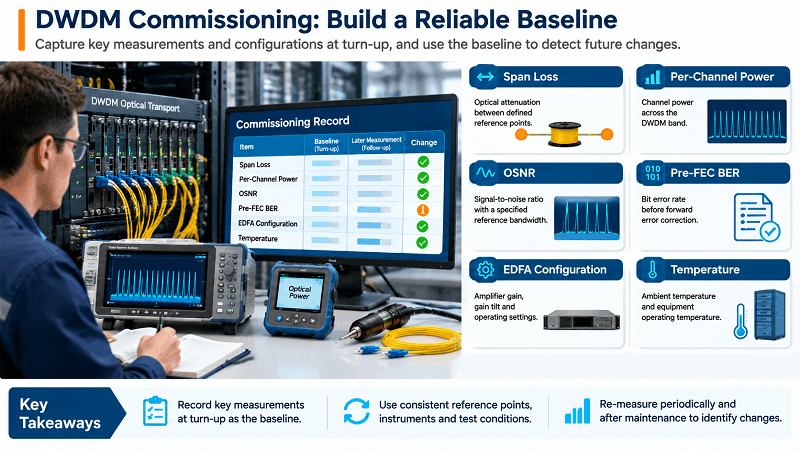
A useful DWDM commissioning record captures the following for each span at turn-up and stores it where the on-call engineer can find it:
- Span loss per span, measured between documented reference points and with the test method recorded.
- Per-channel power across the full band, recorded at the planned channel load and at defined measurement points.
- OSNR at the receive end or other defined reference points, including the reference bandwidth and measurement method.
- Pre-FEC BER and post-FEC performance on every channel, together with available corrected and uncorrected FEC counters.
- Amplifier gain, tilt and other relevant settings as actually configured, not just as specified.
- Ambient temperature and, where available, module and amplifier operating temperatures.
- Instrument model, calibration status, test wavelength, channel loading and measurement date.
Add the date and the instrument used. Then remeasure on a defined schedule and after any maintenance visit that affects connectors, splices, amplifiers or other parts of the optical path. Comparing results with the baseline provides an early warning of degradation.
An acceptance soak matters too. Hold the link at the planned channel load for the duration and temperature range defined by the project acceptance criteria. A 24-hour soak or a full temperature cycle may be appropriate for some projects, but neither is a universal requirement. A link that passes under cool morning conditions may behave differently at a higher operating temperature, so test conditions should reflect the intended deployment environment.
Building a new link or inheriting one? Our engineers can review your commissioning plan and help identify which measurements to capture before handover.
FAQ
What causes low OSNR in DWDM?
Low OSNR can result from amplified spontaneous emission (ASE) accumulated across cascaded optical amplifiers, an amplifier with a high noise figure or an unsuitable operating point, insufficient signal power, excessive span loss, or other system penalties. Filter narrowing, nonlinear effects and channel loading can also affect signal quality.
Each amplifier contributes noise, but the overall OSNR penalty depends on amplifier gain and noise figure, span loss, signal power, channel loading and the complete link design. A simple 10·log10 relationship with the number of amplifiers should not be treated as a universal prediction.
What is a good OSNR value for DWDM?
There is no universal OSNR value. The requirement depends on the modulation format, symbol rate, FEC scheme, receiver implementation, channel frequency and measurement reference bandwidth.
For example, ITU-T G.698.2 specifies different OSNR parameters for its 100G DP-DQPSK application codes. It does not define a universal 400G 16QAM threshold. For a deployed system, use the applicable standard or implementation agreement together with the transceiver specification and link design. Make sure the measurement bandwidth and method match the reference used by the specification.
What is the difference between pre-FEC and post-FEC BER?
Pre-FEC BER is measured before forward error correction and helps show the error level that the FEC decoder must handle. Post-FEC BER is measured after decoding and indicates the residual bit errors. Both can be reported as numerical values. Corrected and uncorrected codeword counters provide additional information about FEC activity.
Monitor Pre-FEC BER trends and post-FEC performance together. The acceptable Pre-FEC BER depends on the FEC scheme and transceiver implementation, so use the applicable equipment specification rather than a universal threshold.
How do I know if a fiber connector is dirty?
Inspect the connector with a suitable fiber inspection probe and assess the end face against the criteria in IEC 61300-3-35. Visual inspection from a distance is not reliable because small debris, scratches and defects may not be visible to the naked eye.
If contamination is found, clean the connector using an approved method and reinspect it before reconnection. Visual inspection does not replace attenuation or return-loss measurements when optical performance needs to be verified.
Why does one channel fail while others are fine?
A single failing channel often points to a channel-specific issue, such as its transceiver, patch connection, mux/demux or WSS port, wavelength assignment or filter path. Check the channel’s presence and power, verify its frequency and port mapping, and compare measurements at both ends.
A single-channel symptom does not completely rule out a shared-path problem. Gain tilt, filter passband limits and wavelength-dependent loss can affect some channels more than others.
What tools do I need for DWDM troubleshooting?
A practical starting kit includes an optical channel mo
nitor or optical spectrum analyzer, an optical power meter, a suitable light source for out-of-service span-loss testing, and a fiber inspection probe with compatible cleaning supplies.
An OTDR is useful for locating fiber breaks, bends and splice events. Dedicated chromatic-dispersion or PMD test equipment may be needed when those impairments are suspected. For live DWDM links, use approved in-service monitoring and test procedures. FiberMall supplies fiber inspection probes, fiber cleaning products and other fiber tools; measurement instruments are available from test-equipment vendors.
Conclusion
DWDM troubleshooting is a measurement discipline. A structured approach helps separate a quick corrective action from a lengthy and unnecessary hardware replacement.
Start with the measurement that best matches the symptom. Per-channel power helps distinguish channel-specific from common-path issues. OSNR and Pre-FEC BER help assess signal quality and remaining FEC margin. Span-loss measurements, compared with the link budget and commissioning baseline, help identify changes in the physical path. The order should follow the fault symptoms and network topology rather than a rigid sequence.
Check simple causes such as connector contamination before ordering hardware, but do not assume that every intermittent error is caused by a dirty connector. Likewise, do not replace fiber or an amplifier until measurements point to that part of the system.
And capture the baseline at commissioning. A measurement without a reference is just a number, and an engineer who inherits a link with no records has a much harder job identifying what has changed.
Send FiberMall your span data and commissioning records, and our engineers can help you work through your DWDM troubleshooting sequence: what to measure next and how to interpret the results.
Related Products:
-
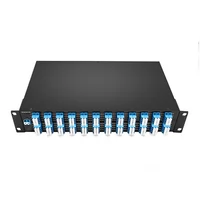
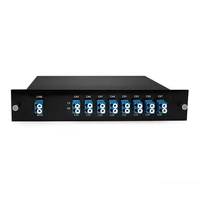
 DWDM MUX DEMUX 50GHZ 96CH (C15-C62) LC/UPC Dual Fiber 2U Rack
$6000.00
-
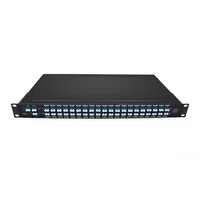
DWDM MUX DEMUX 40CH (C21-C60) LC/UPC Dual Fiber 1U Rack
$1100.00
-
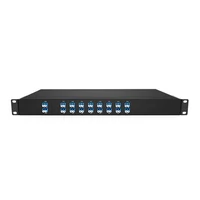
DWDM MUX DEMUX 16CH (C21-C36) with Monitor Port LC/UPC Dual Fiber 1U Rack
$800.00
-
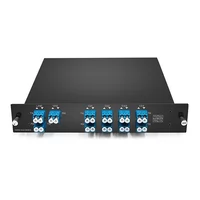
DWDM MUX DEMUX 8CH (C21-C28) with Express Port LC/UPC Dual Fiber LGX BOX
$500.00
-
DWDM MUX 8CH 16 Wavlengths (TX: C43/C45/C47/C49/C51/C53/C55/C57 RX: C44/C46/C48/C50/C52/C54/C56/C58) with MON Port LC/UPC Single Fiber LGX BOX
$450.00
-
SFP-DW10G17-40C 10G DWDM SFP+ C17 100GHz 1563.86nm 40km LC SMF DDM Transceiver Module
$155.00
-
SFP-DW10G17-80C 10G DWDM SFP+ C17 100GHz 1563.86nm 80km LC SMF DDM Transceiver Module
$175.00
-
SFP-DW10G17-100C 10G DWDM SFP+ C17 100GHz 1563.86nm 100km LC SMF DDM Transceiver Module
$235.00
-
SFP-DW10GTU-40C 10G DWDM Tunable SFP+ 50GHz 1529.55nm~1561.83nm 40km LC SMF DDM Transceiver Module
$550.00
-
SFP-DW10GTU-80C 10G DWDM Tunable SFP+ 50GHz 1529.55nm~1561.83nm 80km LC SMF DDM Transceiver Module
$750.00
-
OSFP-400G-DCO-ZR 400G Coherent OSFP-DCO ZR C-band Tunable Optical Transceiver Module
$7000.00
-
OSFP-400G-DCO-ZR+ 400G Coherent OSFP-DCO ZR+ C-band Tunable Optical Transceiver Module
$7000.00
-
OSFP-800G-DCO-ZR+-HTx 800G Coherent High TX Power OSFP DCO ZR+ C-band Tunable Optical Transceiver Module
$12000.00
-
OSFP-800G-DCO-ZR-HTx 800G Coherent High TX Power OSFP DCO ZR C-band Tunable Optical Transceiver Module
$11000.00
-
QSFP-DD-400G-DCO-ZR 400G Coherent QSFP-DD DCO C-band Tunable Optical Transceiver Module
$4550.00
-
QSFP-DD-400G-DCO-ZR+ 400G Coherent QSFP-DD DCO C-band Tunable Optical Transceiver Module
$4680.00
-
QSFP-DD-400G-DCO-ZR+-HTx 400G Coherent High TX Power QSFP-DD DCO OpenZR+ C-band Tunable Optical Transceiver Module
$5500.00
-
QSFP-DD-400G-DCO-ZR-HTx 400G Coherent High TX Power QSFP-DD DCO ZR C-band Tunable Optical Transceiver Module
$5200.00